Trading Intraday Volume Cycles Using a Genetic Algorithm
Detect Intraday Volume Cycles for the E-mini S&P 500 Futures using a Genetic Algorithm
One of the ways of analyzing cycles in financial data is to detect cycles in traded volume. In particular, there are interesting correlations between the fixed amount of volume traded and price reversals in intraday trading. If you are able to detect these static volume figures that can explain intraday price movements, you have an edge for your trading strategy.Thus, instead of time-based cycles, it makes much sense to look for fixed amount of volume cycles to spot market turns.
However, once you have detected the active correlations between volume cycles and price movements, this behavior will not remain static. It is, therefore, quite difficult to keep pace with the dominant volume cycles as these cycles are dynamic. On a daily basis, the volume cycles will adjust according to the traders available as they represent the available volume that needs to be traded in either direction for the direction of the price movement to change.
A genetic algorithm (GA) is a promising way to detect volume cycles and to incorporate the flow of traders intraday. It is a new alternative to using digital signal processing for detecting possible cycles. Akin to chromosomes in a genome, a GA will check possible cycle length settings for long, short, and exit signals. The genome transforms based on an evolutionary process that involves mutation, crossover, and survival of the fittest. Similarly, based on a random population of cycle genomes, the GA will evolve to detect useful volume cycles at different starting points and optimize these cycles based on the rules of natural evolution. Each genome is measured against a special fitness function that simply checks the equity curve if you would have traded these volume cycles.
This strategy requires a charting and analysis platform that can chart the data, apply cycle analysis, use GAs, and apply alerts based on the strategies identified for real-time trading. The WhenToTrade charting software allows you to incorporate all these requirements into your trading strategy.
The following example illustrates the application of this strategy of trading volume cycles in practice. The strategy was actually applied before market hours and has been recorded live during the trading session. Thus, you can review the trade result through the video link at the end of this article.
Setting up the chart before the trading day starts
This strategy uses an 8000 volume chart for the S&P500 eMini futures; that is, a bar will be plotted after the trading volume has reached 8k. Thus, the x-axis indicates a linear fixed amount of volume and not time. Thus, the cycle length in these charts does not represent a fixed time period, but a fixed amount of volume.
In our example, we set our intraday trading strategy on January 17 2014 at 7:00 am NY time, one hour before the major US market opens. We apply the GA to the data for the prior two weeks in order to evolve the cycle genomes. Data from January 2–15 is used for the GA process. Data for the out-of-sample period, January 15–16, is used to verify the results.
We use the relative strength index (RSI) to analyze the volume cycles on the price chart for this realtime example. The RSI works as an oscillator and is cyclical in nature; therefore, it can be used to detect cycles. Once the RSI for the volume bars crosses a special value, a signal will be generated. Each trading signal has two parameters—a length setting for the RSI and an individual threshold value that represents the cut-off value for the signal to be generated. The combination of the crossover threshold and the RSI length represents fixed active cycle measures through the RSI indicator. We allow individual combinations of these parameters for long, short, and exit signals. Thus, we assume that different volumne cycles are active to trigger long and short signals. This enables us to remain in sync with the real characteristics of traders’ emotions, as short cycles are mostly faster and sharper than long cycles.
The generic script to apply this signal is as follows:
CROSSOVER(
RSI(close,LENGTH), TRESHOLD )
The GA was run for just 3–5 minutes and the fittest genomes from the population were identified. There is an important benefit of GA over brute force optimization algorithms:
A brute force technique checks each parameter combination for local optima. For our example, this would imply the following search space: The RSI length can take values between 5–35 and the crossover threshold can take 30 different values. Thus, each independent signal can have 30*30=900 possible parameter combinations. This results in a search space of over 600 billion possible trading strategies (900x900x900x900).
A brute force algorithm must check all combinations for the best combination. In most cases, this is not possible within a short period and, therefore, not applicable in an intraday trading setup where the results are required in the morning before the market opens. On the other hand, the GA can spot profitable combinations within three minutes in this huge search space based on the rules of natural evolution. The process of natural evolution is more similar to the behavior of cycles and the dynamic component within the markets. Thus, the characteristics of GA are similar to the way cycles drive financial markets.
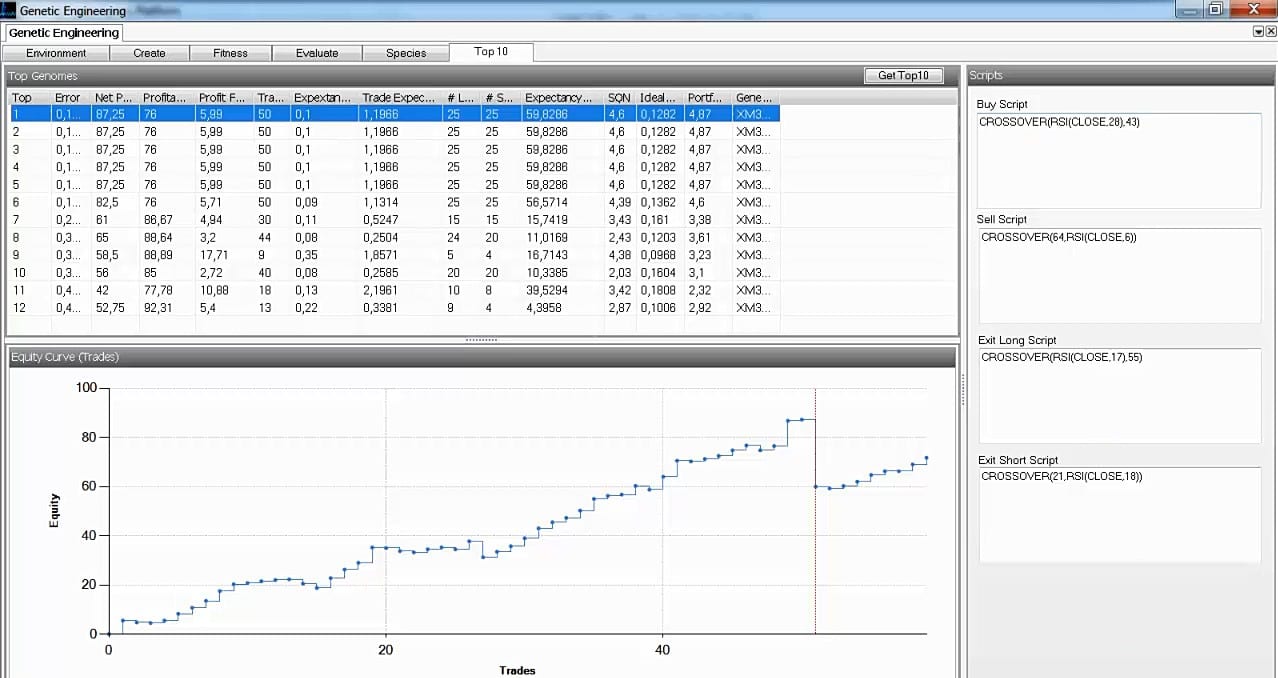
Picture 2 plots the trading system characteristics for each genome identified from the population. The genomes are sorted by the fitness function that seeks constant upward sloping equity curves based on the given fitness criteria.
Picture 2: GA results after three minutes
The GA was able to detect cycles within the RSI oscillator of the volume chart that generated a profitability of 76% or 86 e-mini futures points from January 2-15. The equity curve is a constant upward sloping line that indicates constant profit per trade and low risk. Even the out-of-sample equity curve for the last two days (the area to the right of the red line) exhibits the same behavior, which is promising.
Attach the “fittest” cycles found by the GA to realtime trading chart
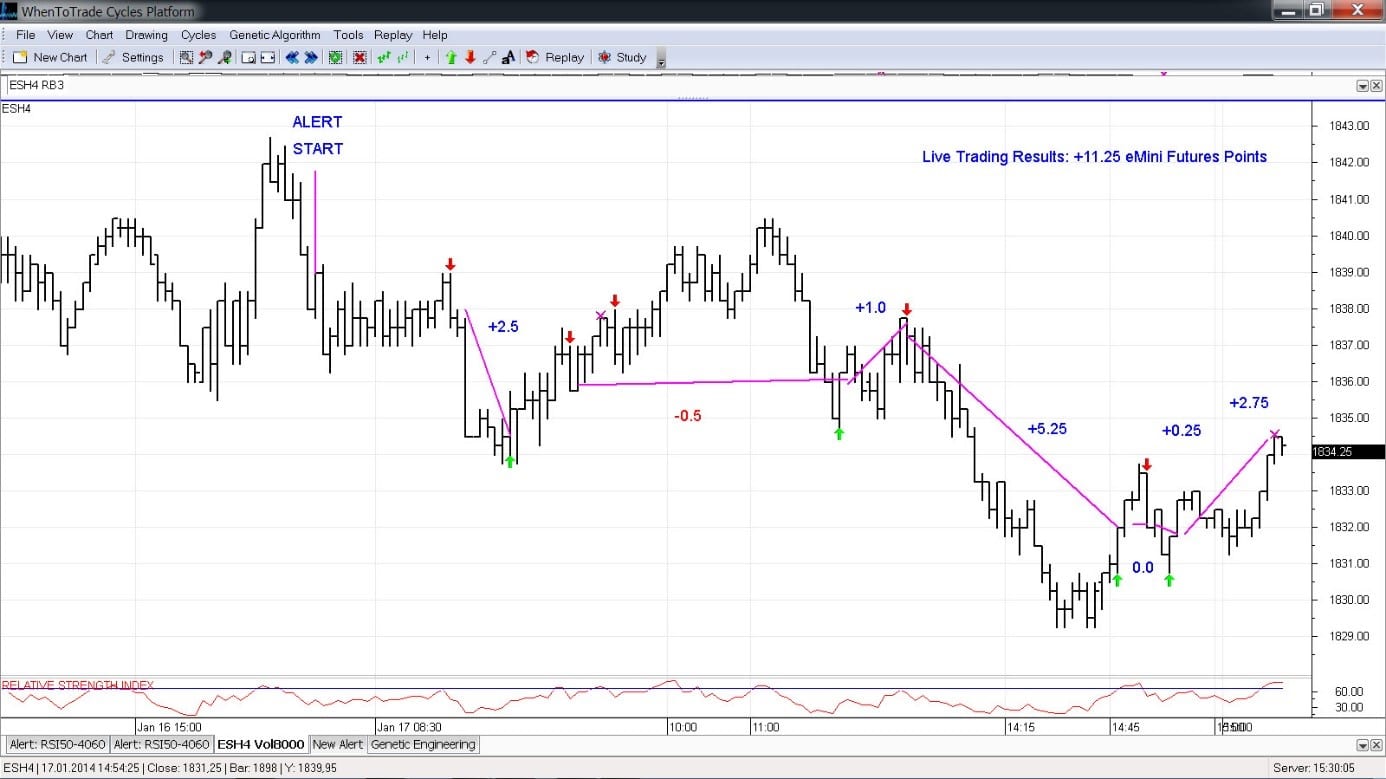
Based on these statistics, the GA seems to be fit to be applied to real market conditions. Thus, we applied this system to live market conditions. The scripts generated in the right panel of Picture 2 can now be incorporated into any real-time alerting module. The WTT platform includes an alert generator. Thus, the scripts along with the parameters were incorporated into the live alert engine and activated a few minutes before the market opens. In Picture 3, the line “ALERT START” indicates when the alert was applied. From that point in time, the system is monitoring the volume chart according to the rules and real-time incoming signals. The alerts are shown in a special alert window and are directly plotted on the chart as red and green arrows in real time as new bars are plotted.
Picture 3 depicts the results after the trading setup was applied to the chart at market open. The arrows were plotted in real time.
As seen in Picture 3, our detected cycle parameter combinations for the entry and exit signals generated eight trades during the day. Of these eight trades, seven were profitable and generated a total profit of over 11 e-mini futures points for the trading day. The trades shown in the chart have not been incorporated ex-post. This behavior was recorded during the day and you can watch the script in live mode where the last two signals are generated in the chart during the live recording. The video link for this trading day is at the end of this article.
This example demonstrates the power of combining cycle analysis, volume charts, and GAs. Thus, it highlights the power of what is possible if you have the knowledge and tools at hand to utilize the power of cycles and GAs. This article shows how to apply a genetic engine to prepare your trading systems for the trading day.
A PDF version of the article is available for download/print.
The trading chart in large scale is available here in full screen: SHOW LARGE PICTURE 3
Realtime video snapshot of the live trading session
The real-time video, that shows (1) that the GA was run before market open and (2) the method of monitoring the signals generated in real time, is available here:





Leave a Reply
Want to join the discussion?Feel free to contribute!