
Sentiment: How Cycles of Financial Stress Pinpoint Market Turns
Understanding the sentiment cycles in financial stress is critical to generating returns in the current market environment. This article demonstrates the power and importance of sentiment cycles.
Sentiment cycles influence the movement of financial markets and are directly related to people’s moods. Getting a handle on sentiment cycles in the market would substantially improve one’s trading ability.
In this article, we highlight the importance of detecting cycles in sentiment to spot turning points in financial data. The “realtime” case study exemplifies the importance of sentiment cycles and the predictive power of the Dynamic Cycle Explorer (DCE).
The Dynamic Cycle Explorer works on the assumption that cycles are static over time, which is misleading for trading purposes. Dominant cycles morph over time because of the inherent nature of the parameters of length and phase. Typically, one dominant cycle will remain active for a longer period and vary around the core parameters compared to other cycles. As real cyclic motions are not perfectly even, the period varies slightly from one cycle to the next because of changing physical environmental factors. This dynamic behavior is valid for financial market cycles as well.
How does the approach work? Every time a new bar appears on the chart, the Dynamic Cycle Explorer reassesses the state of the current dominant cycle in terms of length, strength, and phasing. Subsequently, it updates this cycle by plotting it onto future projections. However, a trader will focus only on the next expected turning point, which is what a market analyst is interested in. The DCE is not used to predict a complete static cycle far into the future. We are interested in determining and monitoring the next turning point based on the detected dominant carrier wave, which is the point in time where we expect the market to turn.
As we move forward in time, every bar signifies an update of the expected turning point by a reassessment of the current state of the dominant cycle length and phase. This dynamic forecast based on the actual state of the dominant cycle provides information about the time and direction of the next turning point. We obtain real-time information about when to expect the next major turning point in the market as we continuously reassess the parameters of the dominant carrier wave. This information is updated every time a new bar appears. This technique was used in the following market report that was published on 8 June 2014 in the publicly available magazine section. (Link: Read original market update ahead of time.)
Financial Stress Index
The St. Louis Fed Financial Stress Index (STLFSI) is a vehicle that can be used to analyze sentiment data. It is created using principal component analysis, a statistical method for extracting the factors responsible for the correlation of a set of variables. Financial stress has been identified as the chief factor influencing the co-movement of its designated market variables; extracting this factor allows St. Louis Fed to create an interpretable index. The index is constructed using weekly data series for a variety of interest rate, credit spread, and volatility measures.
We can apply our dynamic cycle tools to this dataset and see if we can detect important dominant cycles that forecast financial stress extremes. This exercise was performed on 8 June with the DCE. The Dynamic Cycle Explorer can automatically detect the current active dominant cycle and track the current phasing to forecast the next expected turn.
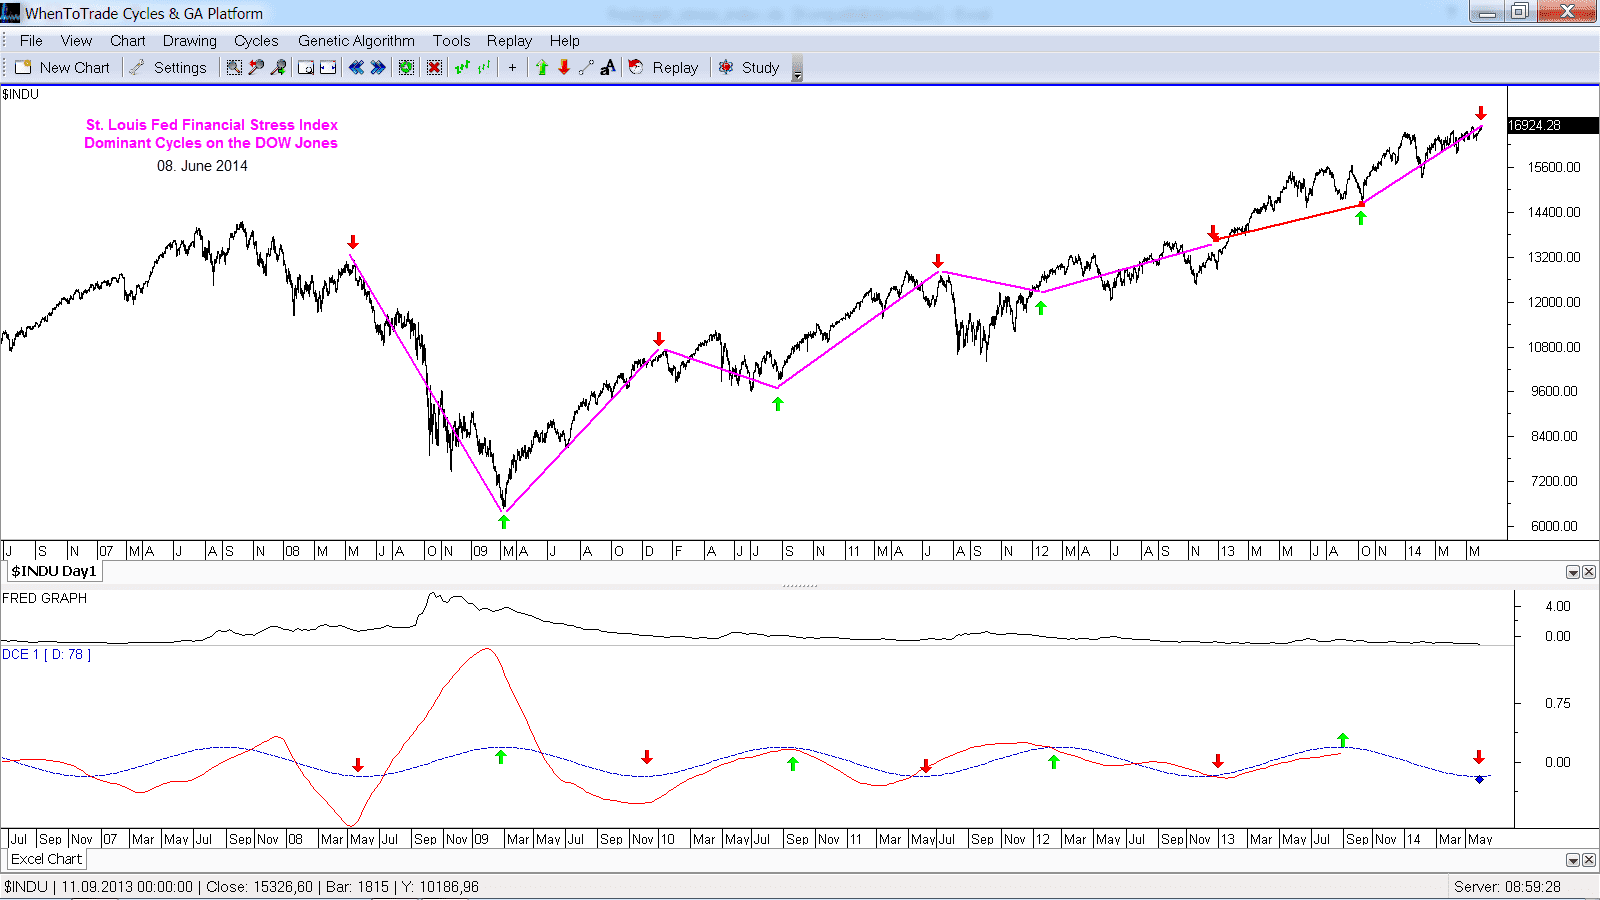
Chart 1: St. Louis Fed Financial Stress Index with Detected Dominant Cycle—78 weeks/cycle low (8 June 2014)
The cycle explorer detected an active “financial stress” cycle with a length of 78 weeks that tracked the latest major market movements. This is shown in the lower panel of the chart where the cycle analysis on the FRED data took place. ( SEE LARGE CHART 1) The source data was accessed via the free Quandl data feed through the symbol FRED/STLFSI and was analyzed with the Dynamic Cycle Explorer. The blue cycle shows the automatically detected dominant cycle; the major turns are indicated with red and green arrows on the price chart to show the correlation with the Dow Jones Index.
Crosscheck signal in VIX “fear” index
The integrated, dynamic phasing analysis projected a current extreme low in the financial stress index at the point of the analysis (8 June). An extreme low in the financial stress index correlates to market highs. The current low in the financial stress index is also spotted as an expected major low of the current dominant “stress” cycle. Therefore, the DCE pointed to a possible market high at the time of the analysis. As is often discussed in our articles, one should always crosscheck for other dominant cycles, especially in other timeframes/vehicles. Another sentiment vehicle that is commonly referred to is the Volatility Index (VIX) — often called the “fear” index. A dominant cycle analysis on the VIX showed another sentiment extreme on the daily timeframe. The daily dominant cycle, which was automatically detected with a length of 152 bars, projected a daily sentiment “fear” low on 8 June. Fear index lows also correlate to market highs.
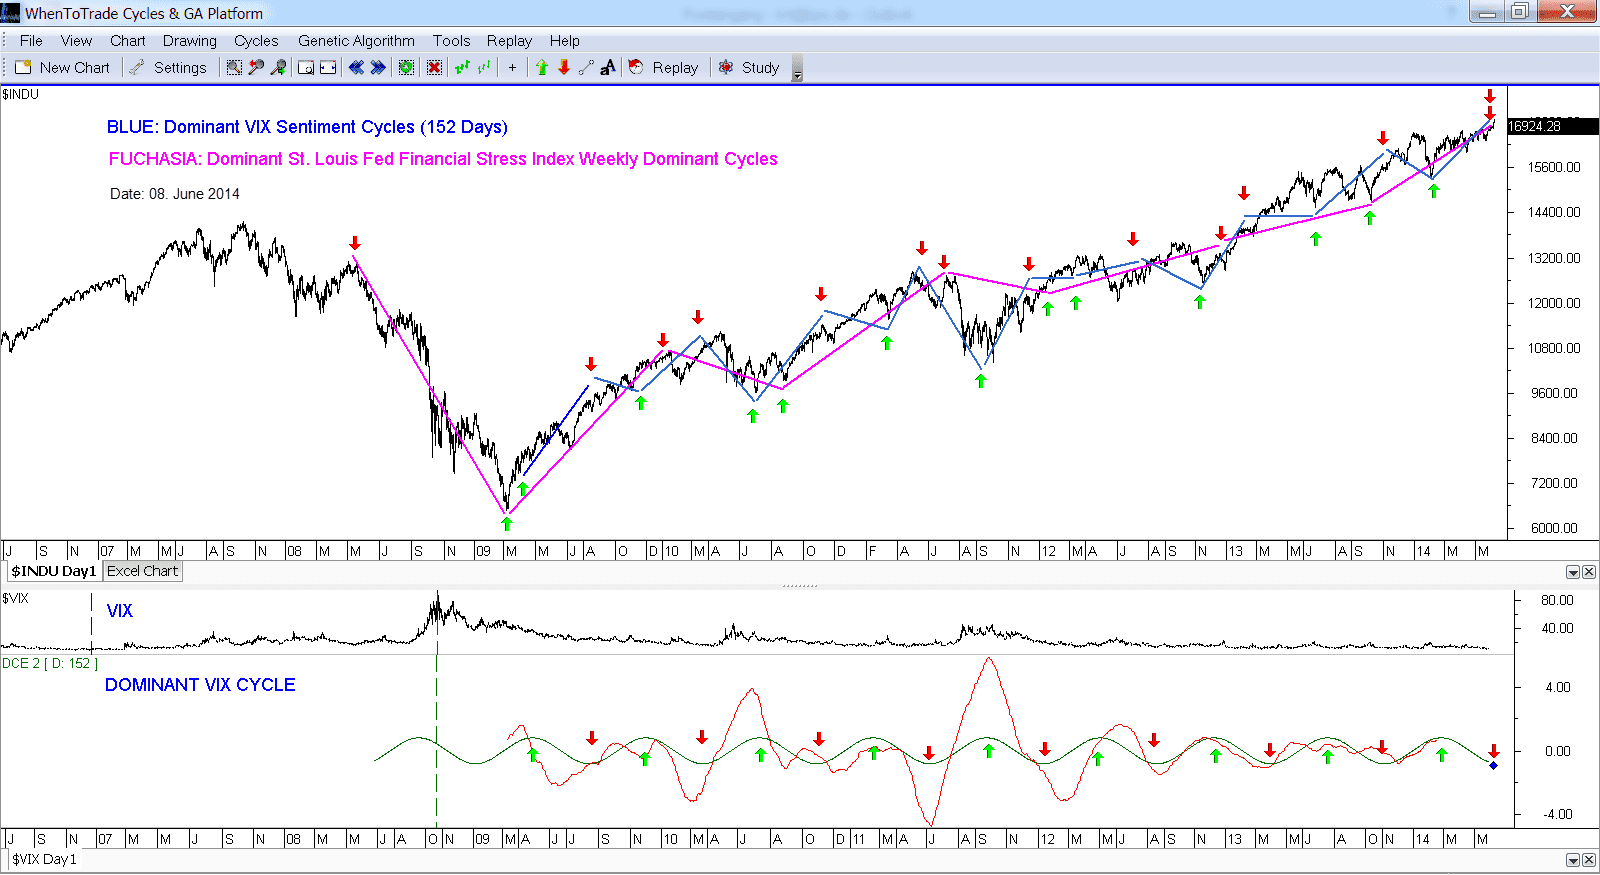
Chart 2: VIX with Detected Dominant Cycle—152 days/cycle low (8 June 2014)
The VIX and the dominant cycle are shown in the lower chart panel. The green cycle was detected automatically by the DCE on the daily data. This cycle (blue line), together with the long-term weekly cycle from the financial stress index (fuchsia line), were mapped to the price chart in the upper window. At the time of the analysis (on 8 June 2014), these two cycles were in perfect alignment, which is a very important cycles-within-cycles alignment. ( SEE LARGE CHART 2 )
The interesting point is that we have two different dominant sentiment cycles from different datasets and different timeframes coming into alignment, and both dominant cycles project a current market high. This analysis together with the forecast of a current market high was posted on 8 June 2014 in the public magazine on whentotrade.com.
How did it turn out…?
A few month later, a review of the blue chip indexes reveals that the high occurred the very next days after the forecast was published. Markets registered a sharp decline of over 10% after the cycle analysis was published and price never showed up for a long time – as the cycle suggested.
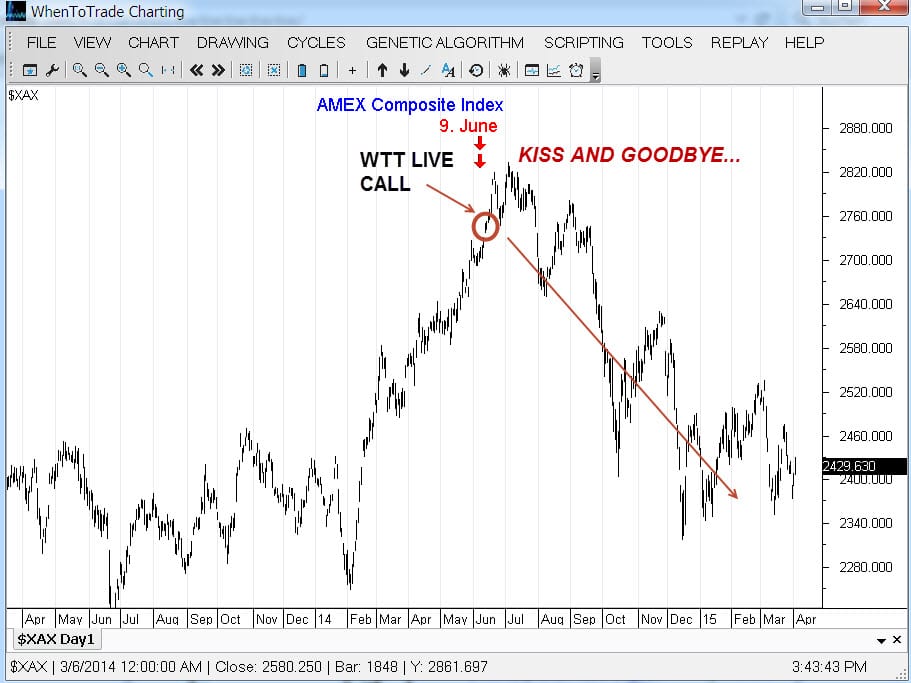
Live Call Review
This example not only proves the ability of the WTT Dynamic Cycle Explorer to predict sentiment cycles ahead of time but also emphasizes the importance of analyzing dominant sentiment cycles as leading indicators of market turns.
Our cycles projection did not only call the top of the year, it represents also the largest drop for the year:
Additional examples and real-time forecasts based on this technique are included in the book Decoding the Hidden Market Rhythm– Part 1: Dynamic Cycles. The original market update post ahead of time can be found here: LINK
Video review of chart analysis
A complete video review (35min.) is available to see how the charts have been setup and the cycle analysis has been done to get this juncture in June.


Leave a Reply
Want to join the discussion?Feel free to contribute!