Features Overview
Charting Module
Charting Module
The footprint of our charting module is small thanks to highly-optimized C++ code. It uses very little RAM and CPU, allowing you to use all 24 of your monitors.
Basic Features:
- WTT Charting supports all of the popular stock chart display styles: Candlestick, OHLCV, OHLC, Heiken Ashi Candles, Darvas Boxes, 3D Candlesticks, Renko, Kagi, Three Line Break.
- Smooth anti-aliased painting for all technical indicators and line studies.
- Real-time automatic technical analysis updating.
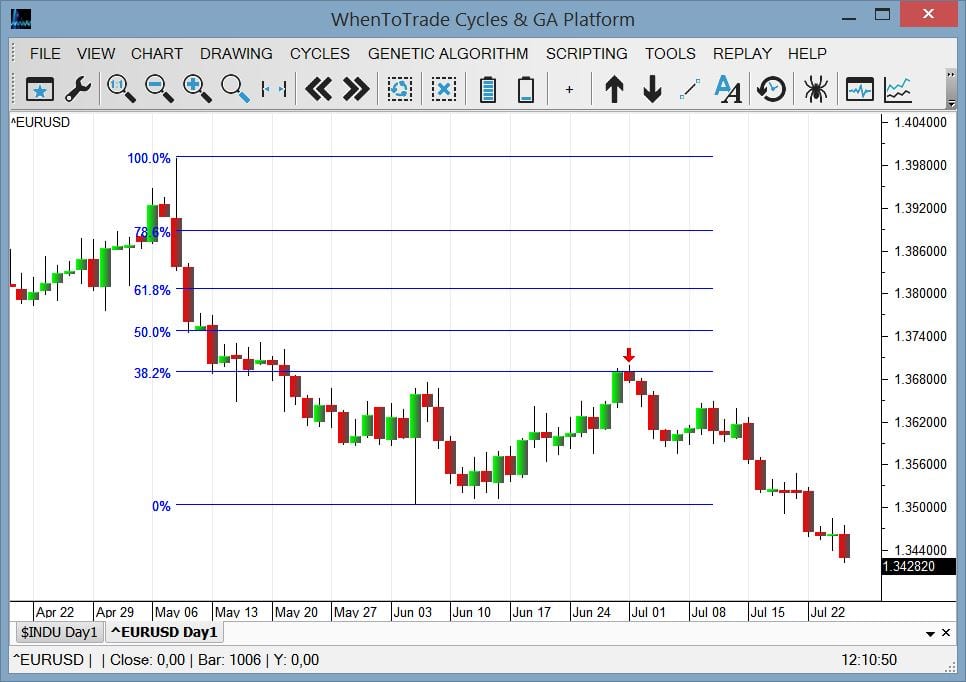
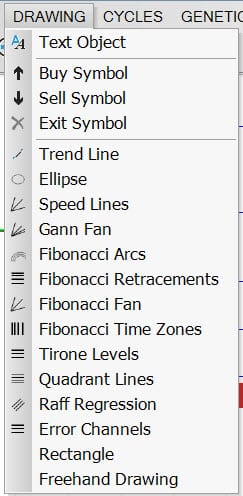
- Support for built-in Line Studies such as Ellipse, Rectangle, Trend Line, Speed Lines, Gann Fan, Fibonacci Arcs, Fibonacci Fan, Fibonacci Retracements, Fibonacci Time Zones, Tirone Levels, Quadrant Lines, Raff Regression, and Error Channels.
- WTT Charting uses double buffering – this means you will see absolutely no screen flickering.
- An unlimited number of series can be displayed in just one chart.
- Data can be imported into the charting module from any database, text file format, or real-time feed.
- Full support for Gregorian/Julian date conversions.
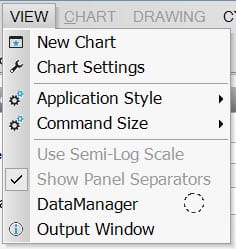
- Windowing system allows users to resize, change positions up or down, maximize, minimize, restore, and close chart windows.
- Chart windows are fully customizable – change height, colors, styles and more.
- The WTT Charting component manipulates screen graphics quickly and efficiently without a 3rd party graphics engine. It uses one of the fastest stock chart controls available in native C++ code.
- Zoom-in, Zoom-out, scroll-left, and scroll-right programmatically or via the keyboard or mouse wheel.
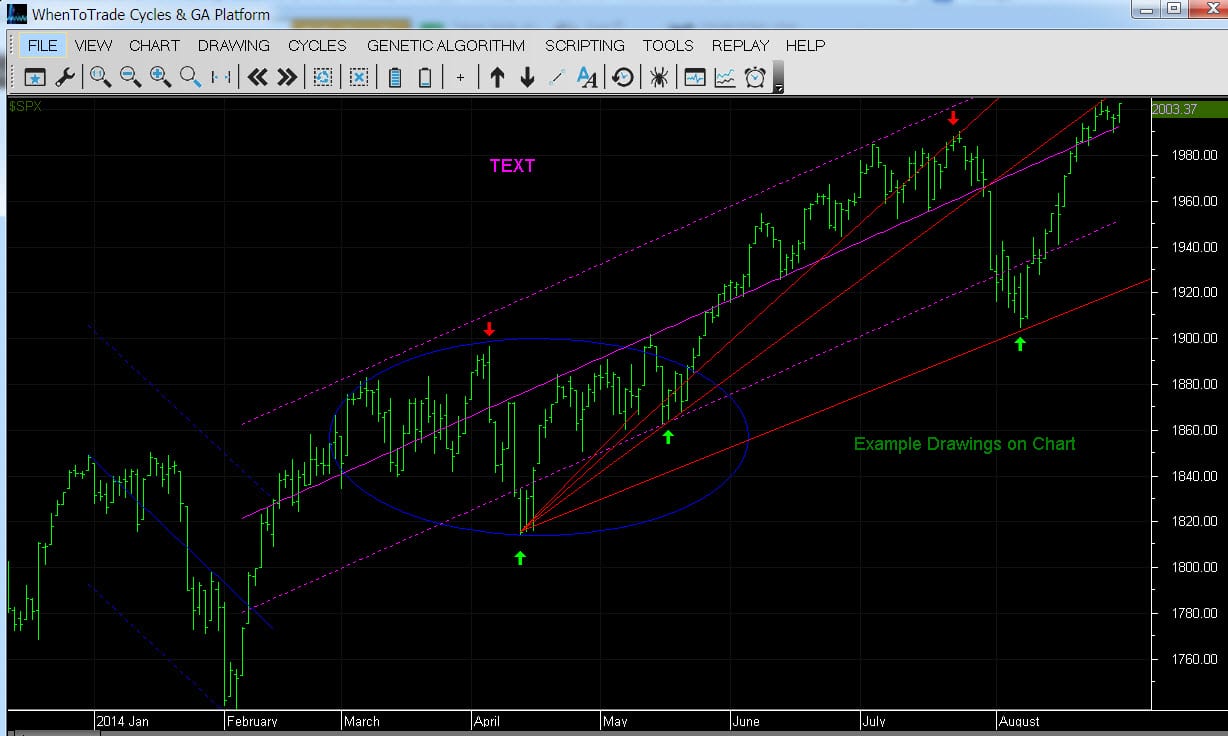
- Supports trend line drawing, objects (buy/sell arrows, text, etc.) and more.
- Export chart images to file (can be displayed on the web) or send to a printer.
- Users can save/load charts, restoring data, indicators, colors, drawings, period objects and more.
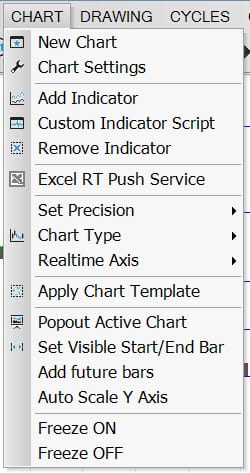
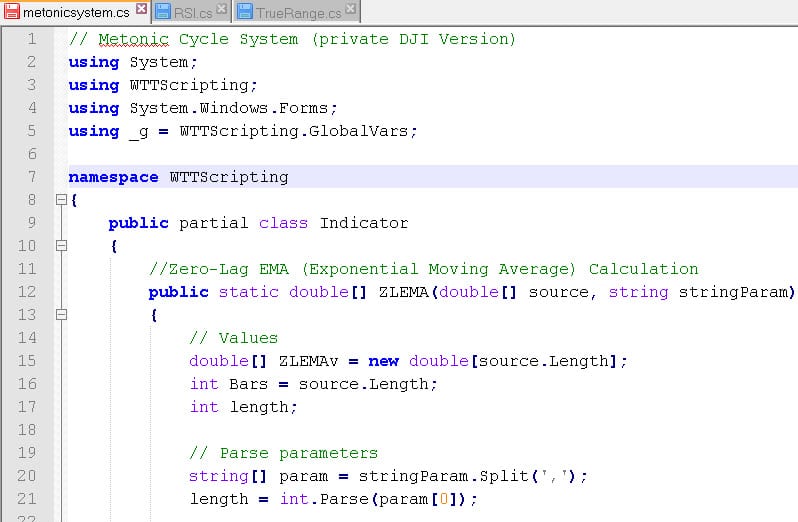
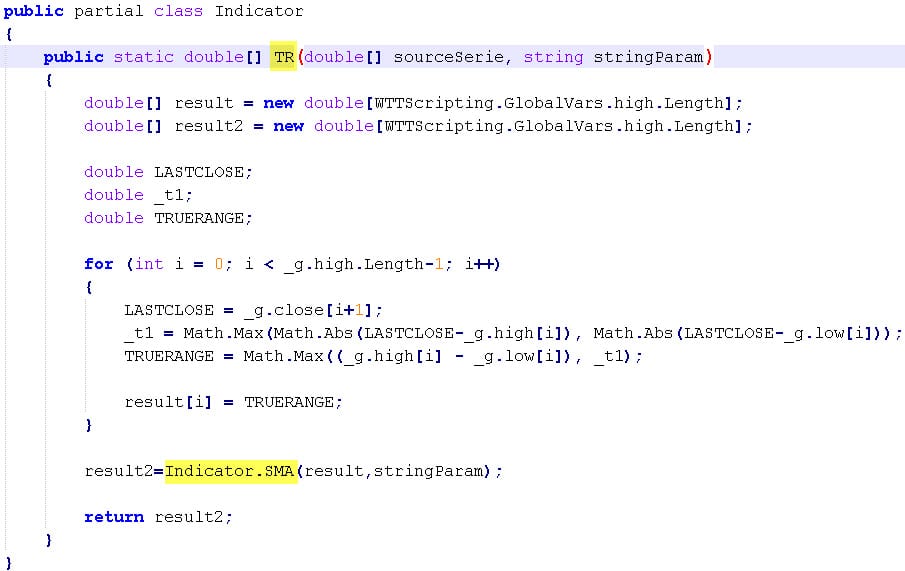
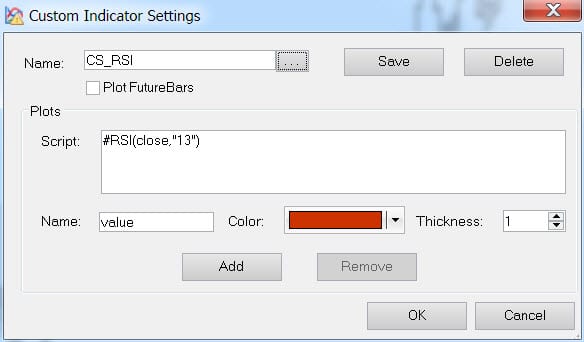
- Allows to add new types of indicators via the WTT C# interface.
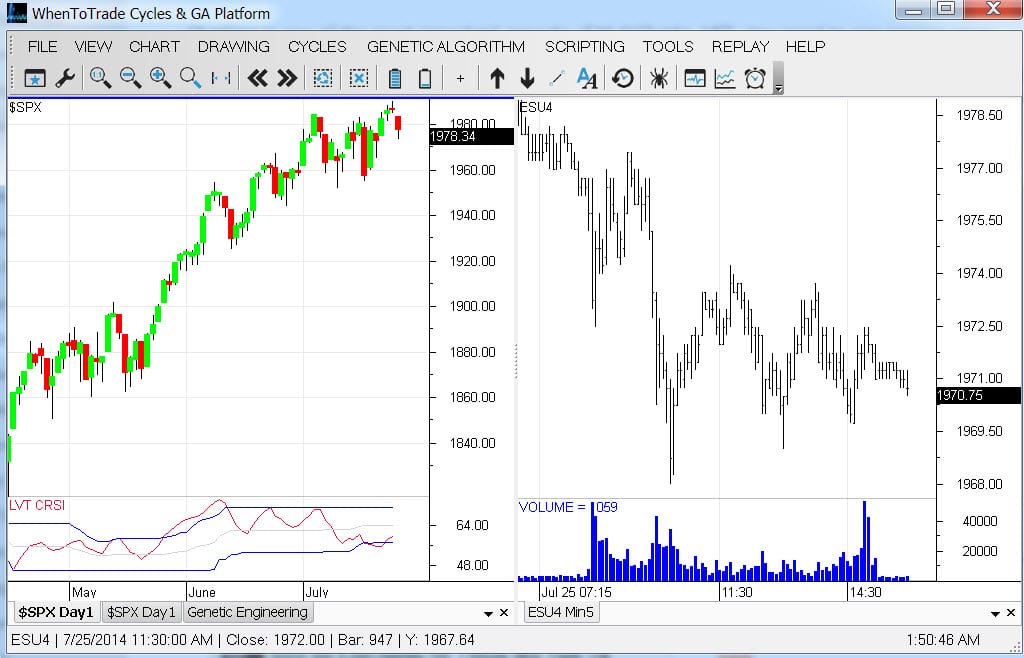
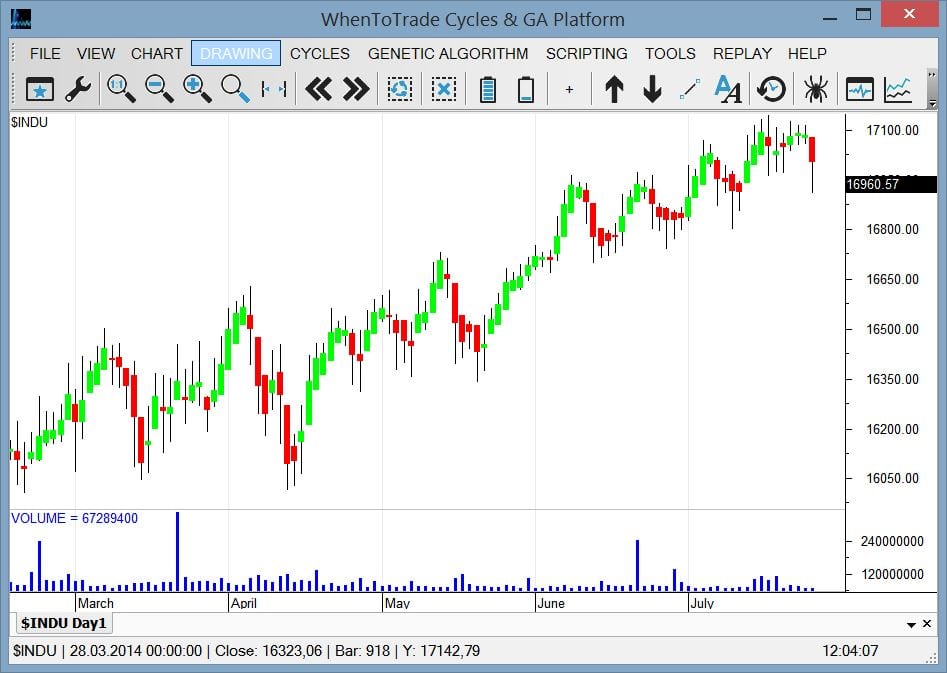
| Different display styles and flexible window configuration. Multi Window/Muli-Screen support. |
|
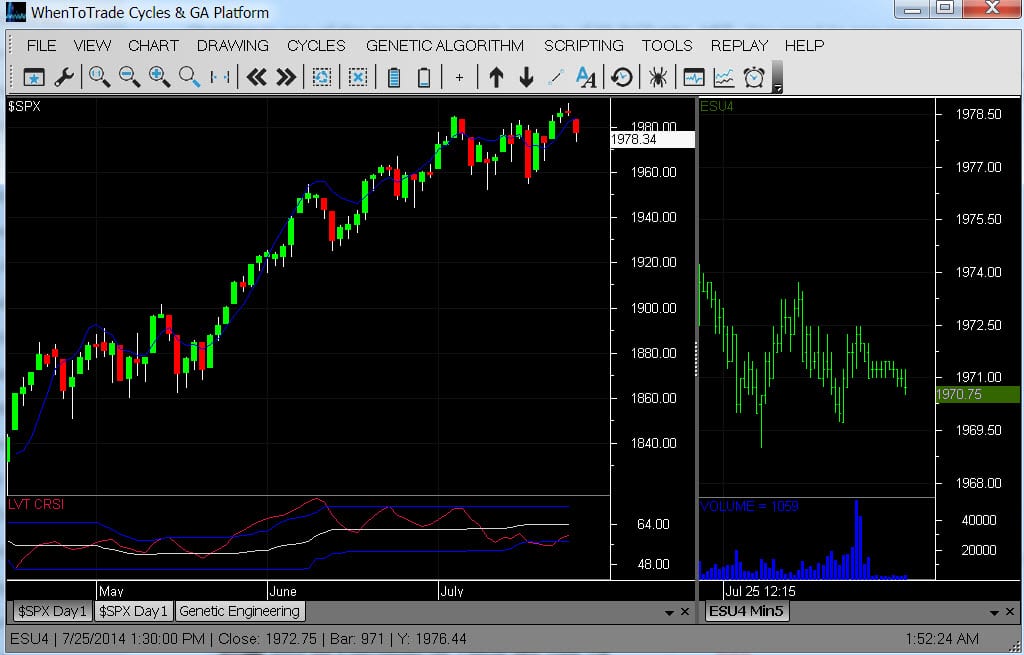
| Pre-configured templates day-/night styles available. |
|
| Individual chart and view configuration for each chart. Menu functions to import Excel and CSV data for individual plotting and analysis. |
|
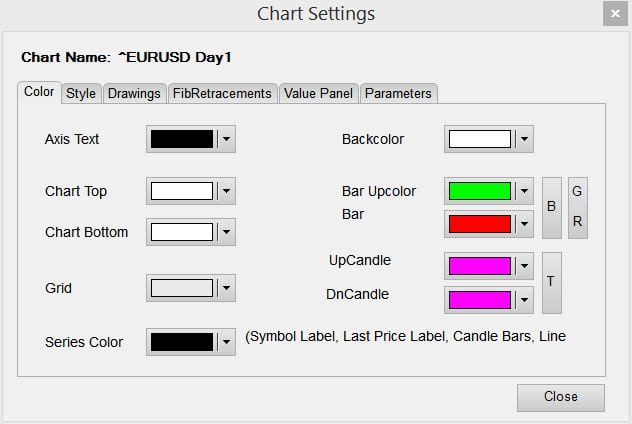
| Chart Settings Panel |
|
| Heikin Ashi Canles |
|
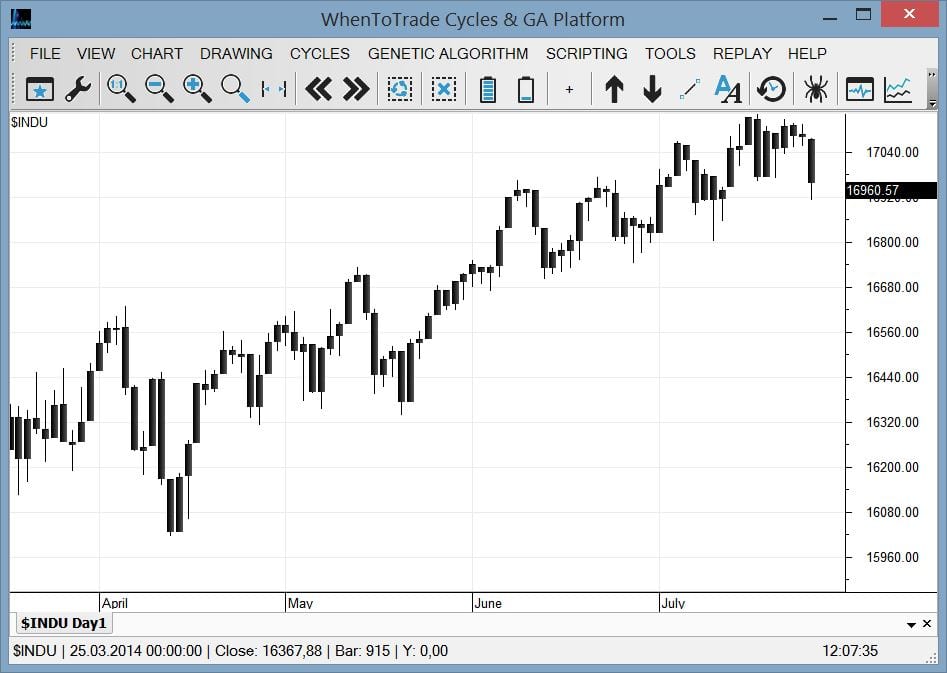
| Black Candles |
|
| 3D Bar Styles |
|
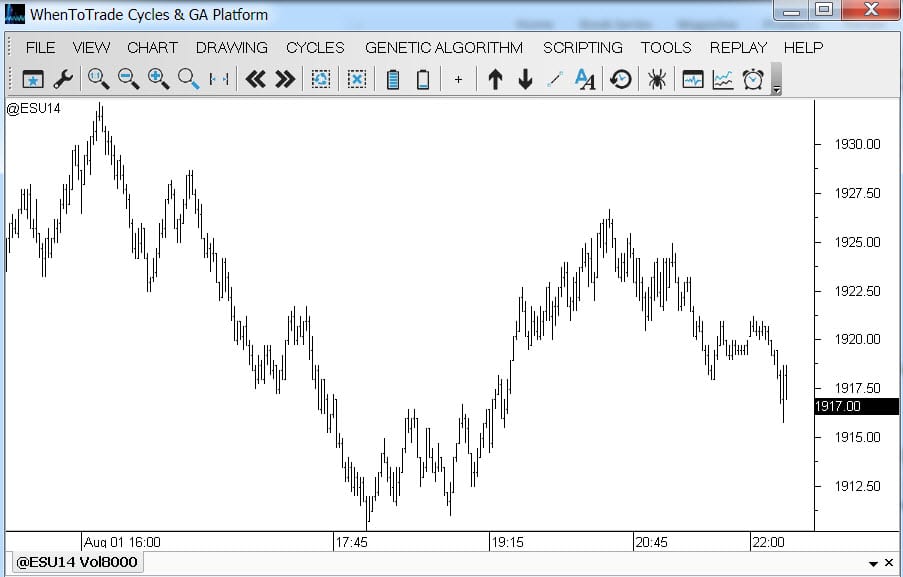
| Volume Charts (Stick Bars)
(eMini Futures 8000 Intraday Volume Chart) Volume Charts are very important to detect and sport dominant cycles based on volume |
|
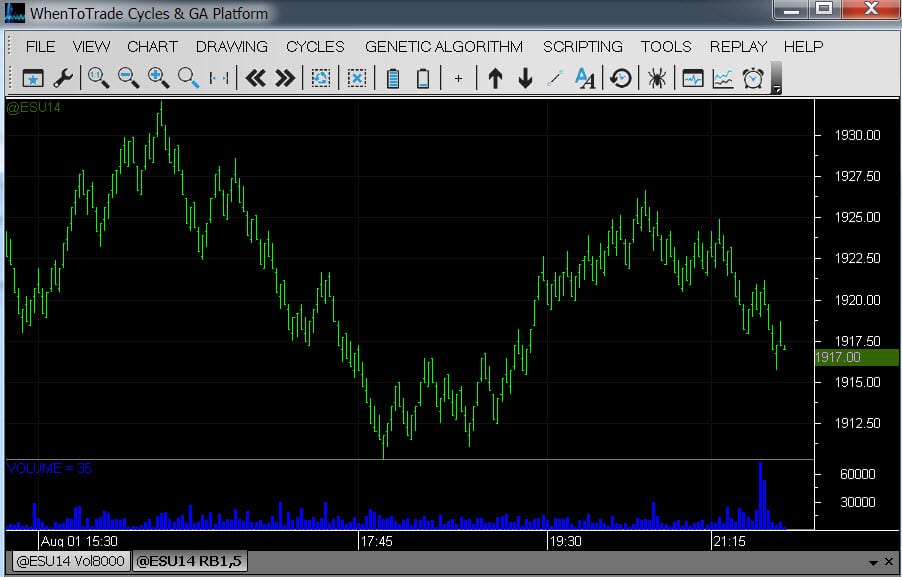
| Range Bars
Offers the ability to monitor price range cycles with the integrated cycle tools. |
|
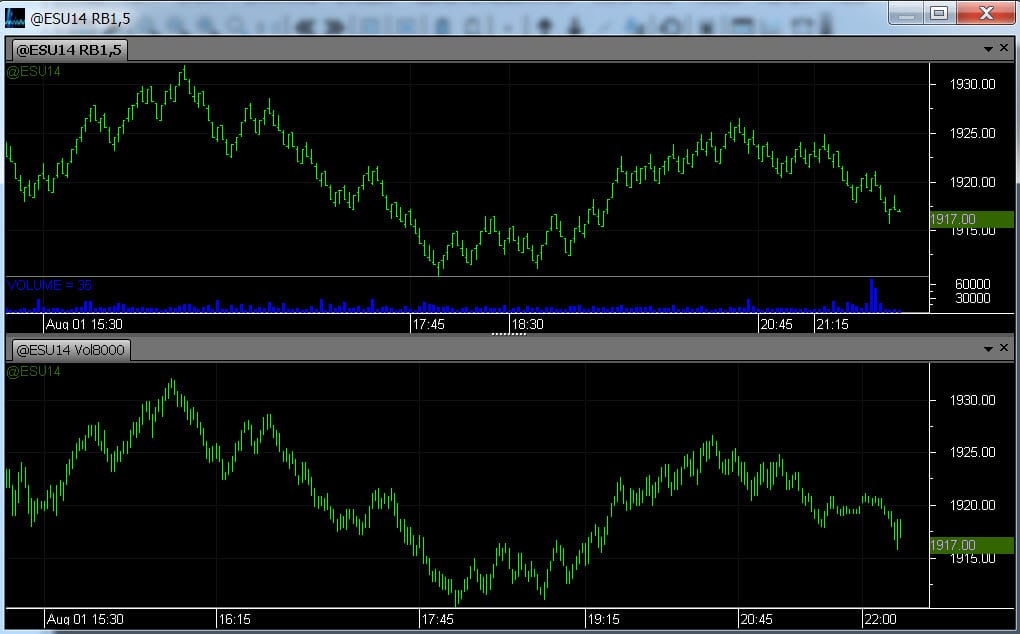
| Multi-Chart Windows
Combine Volume and Range Bar charts in one window to analyze different chart types with one view. [Example: S&P500 eMini futures 8k volume chart and 1.5 Price Range Bars] |
|
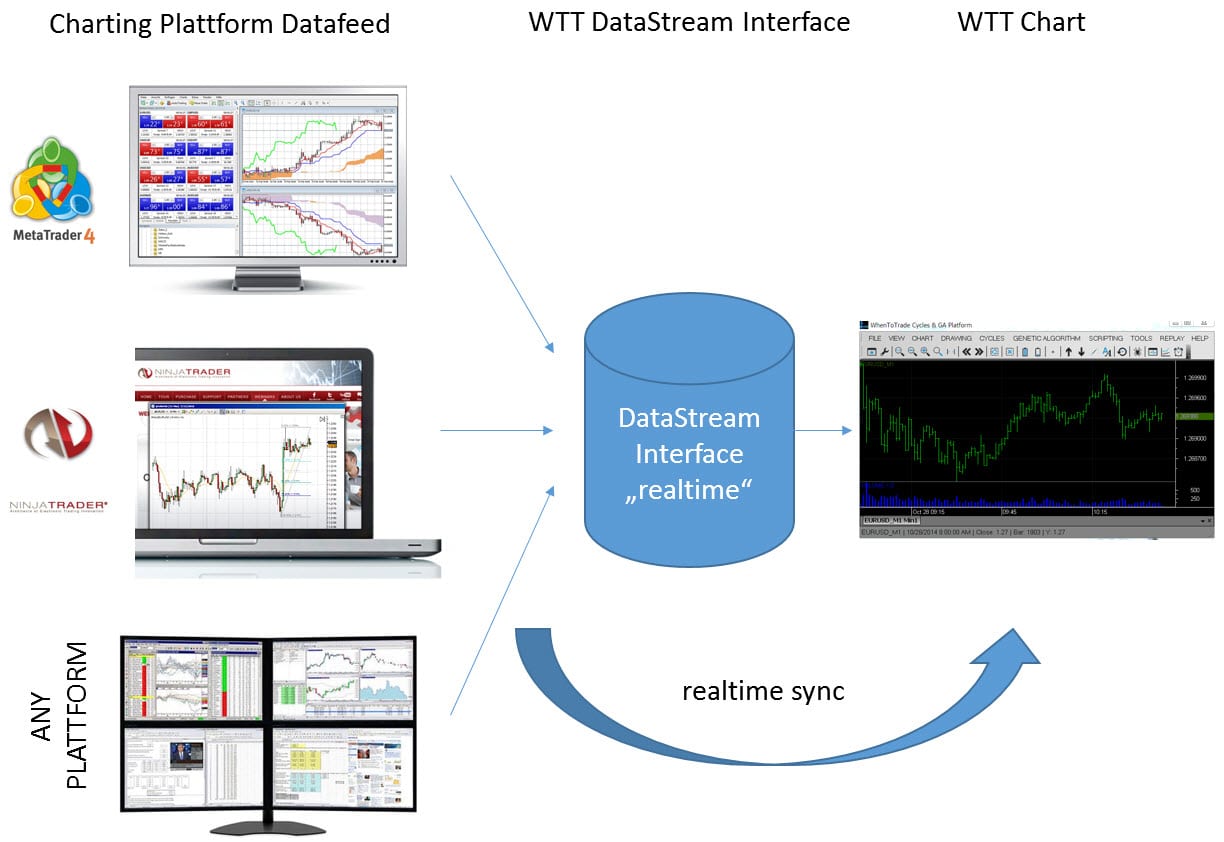
Datafeeds
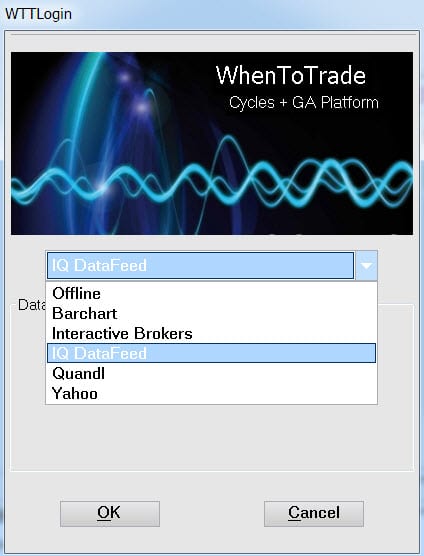
DataStream Technology
Cycle Analysis & Forecasting


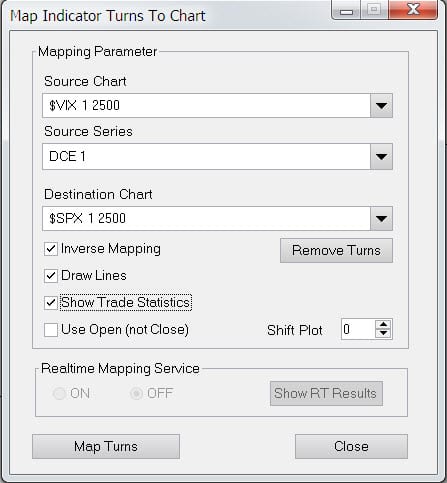
Inter-Market Cycle Mapping / Research
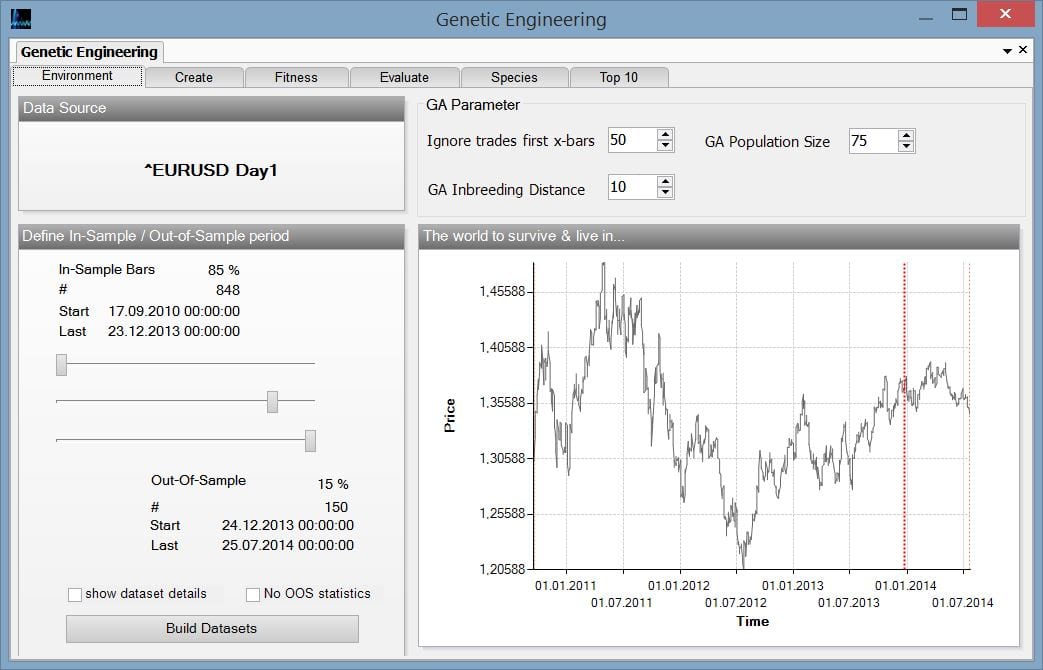
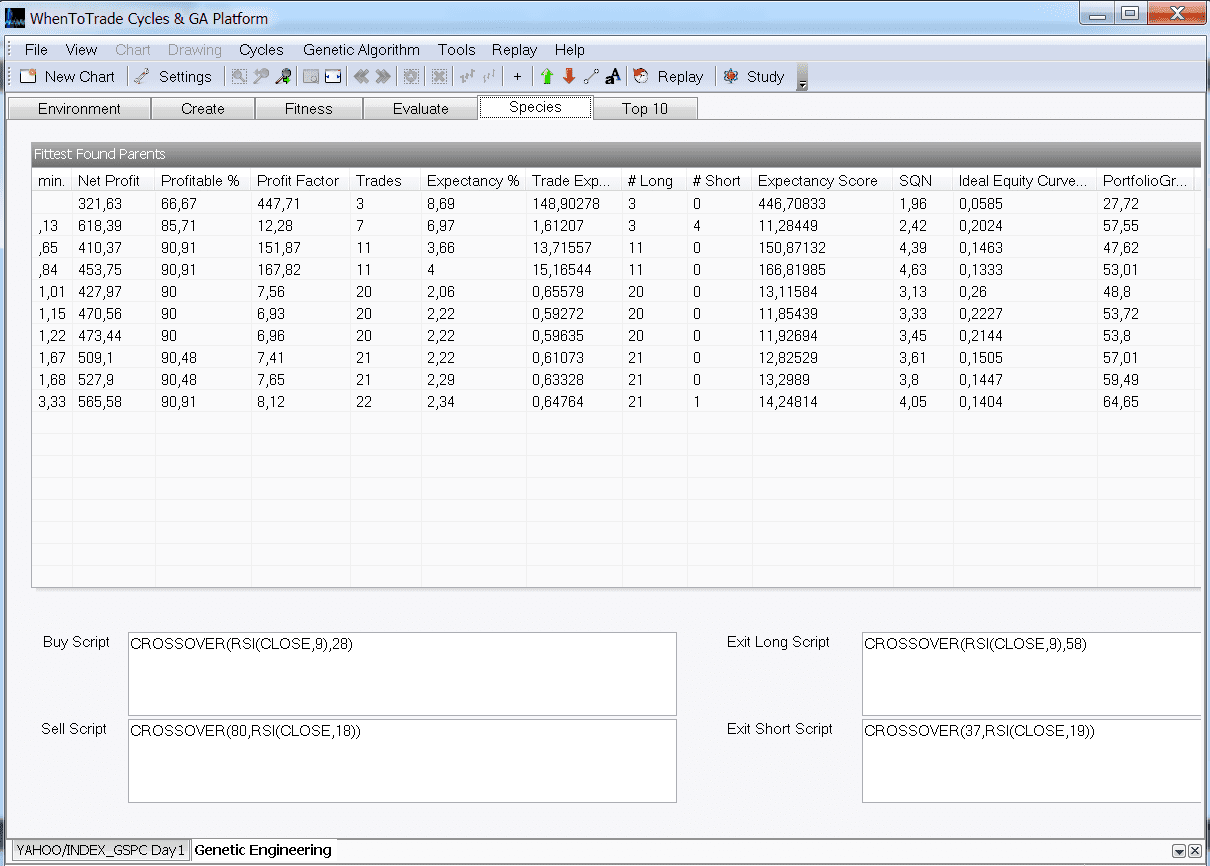
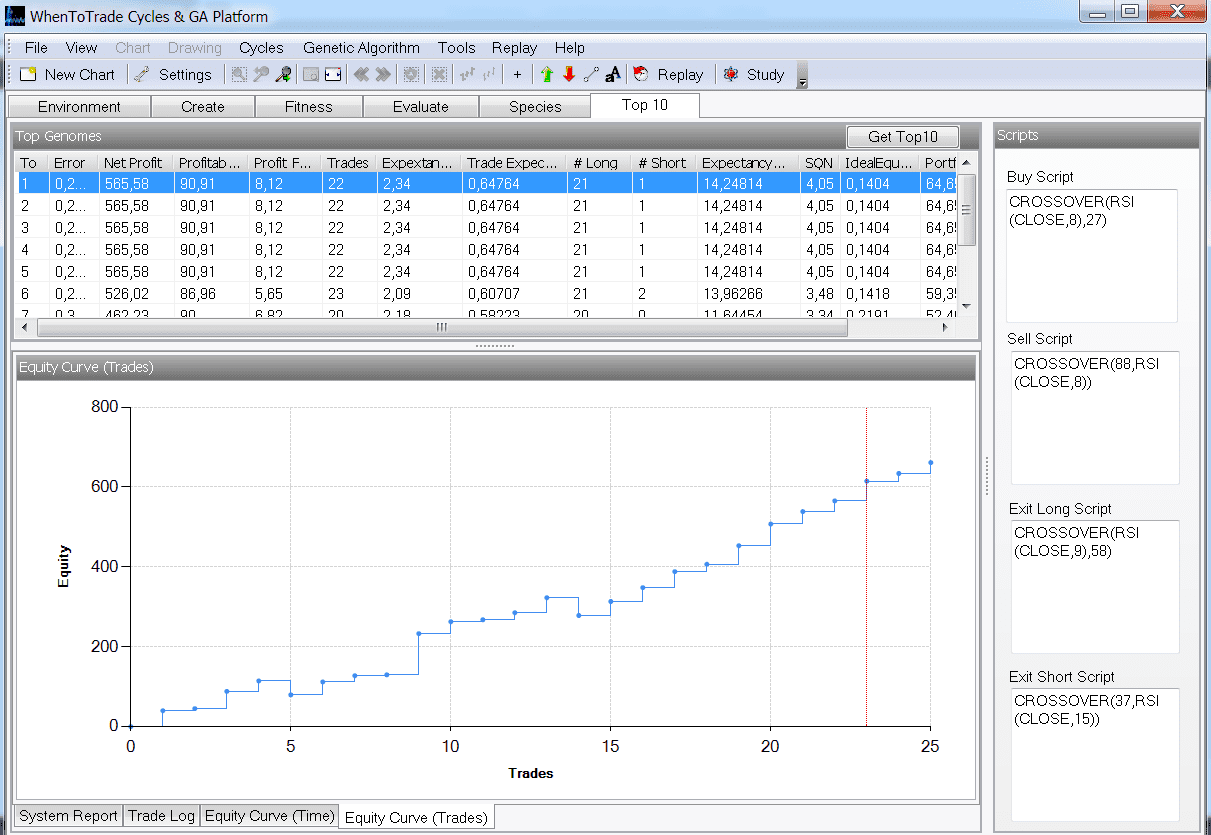
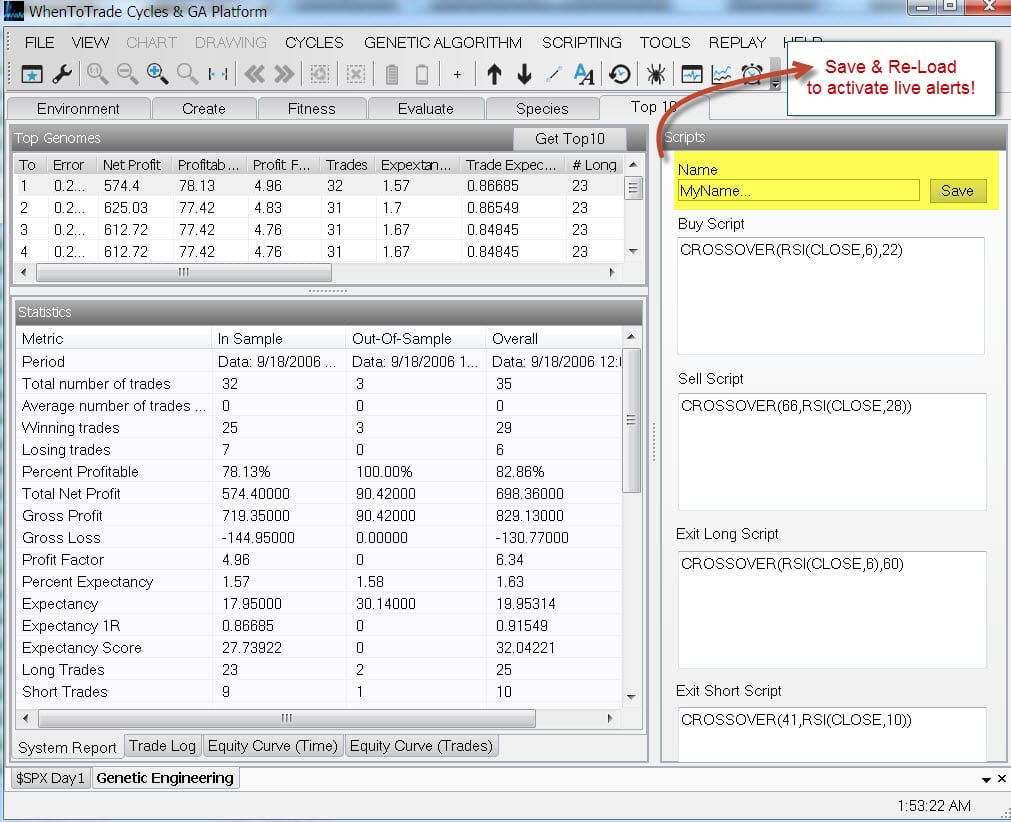
Genetic Engineering Module
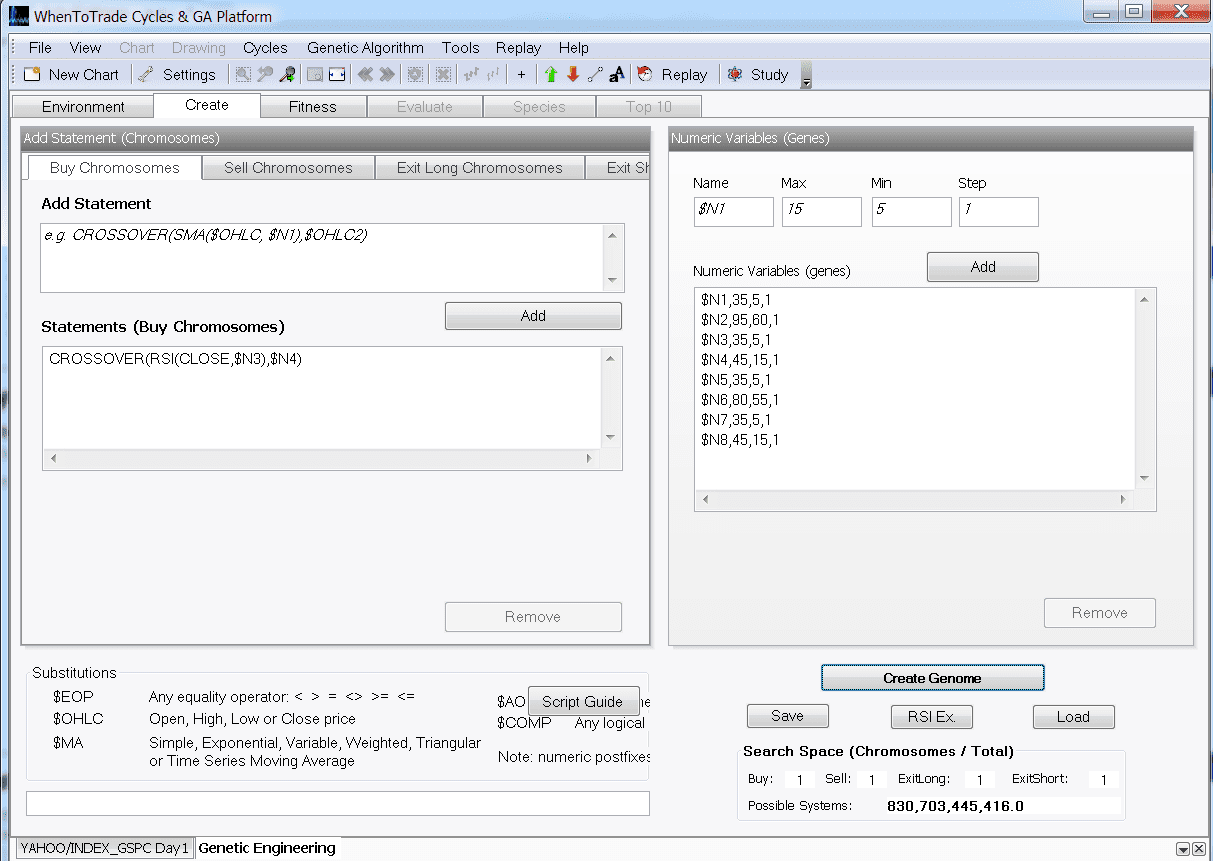
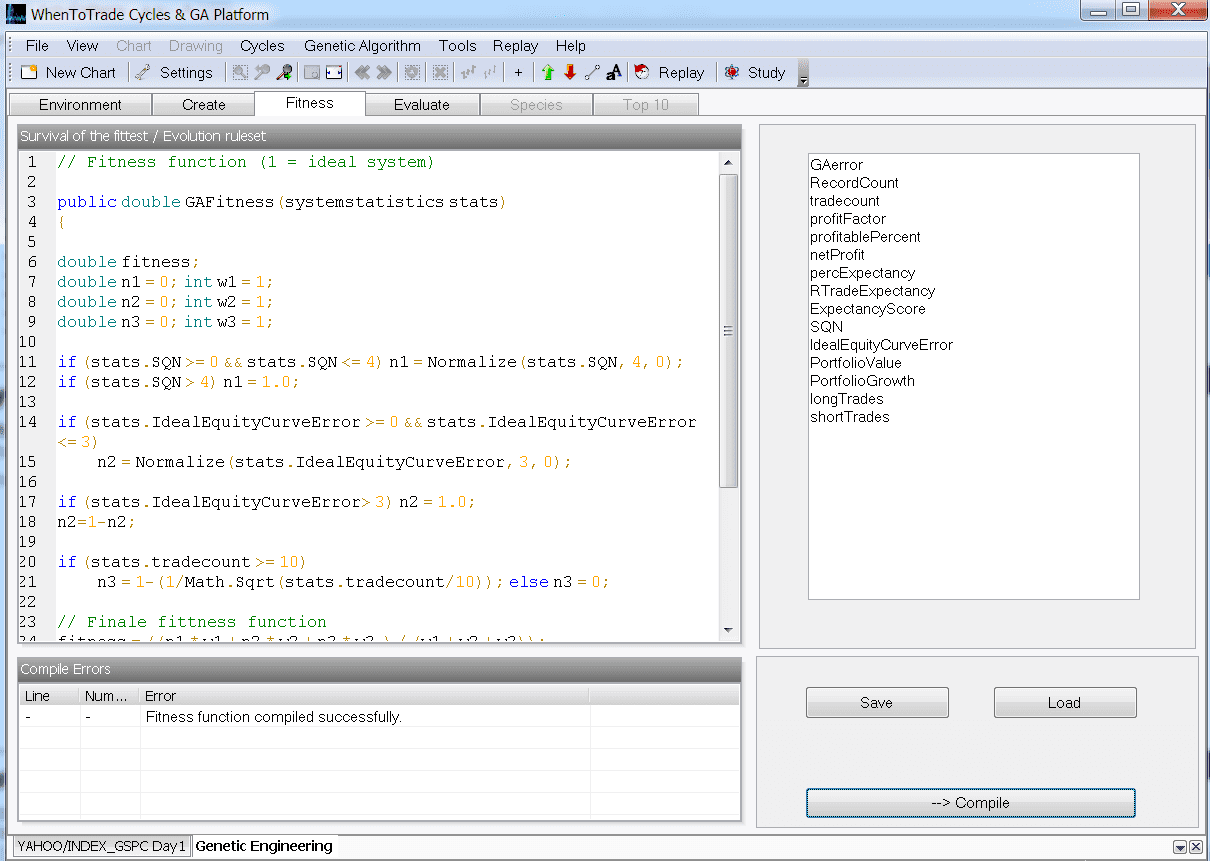
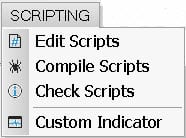
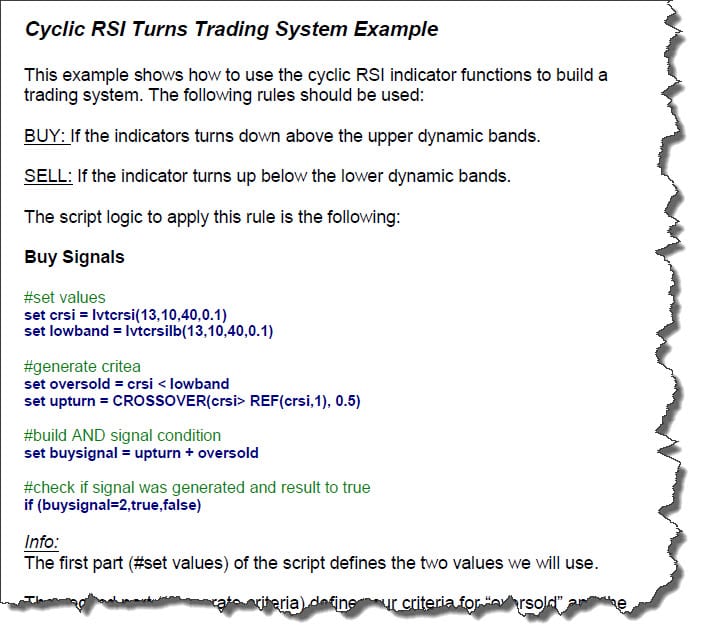
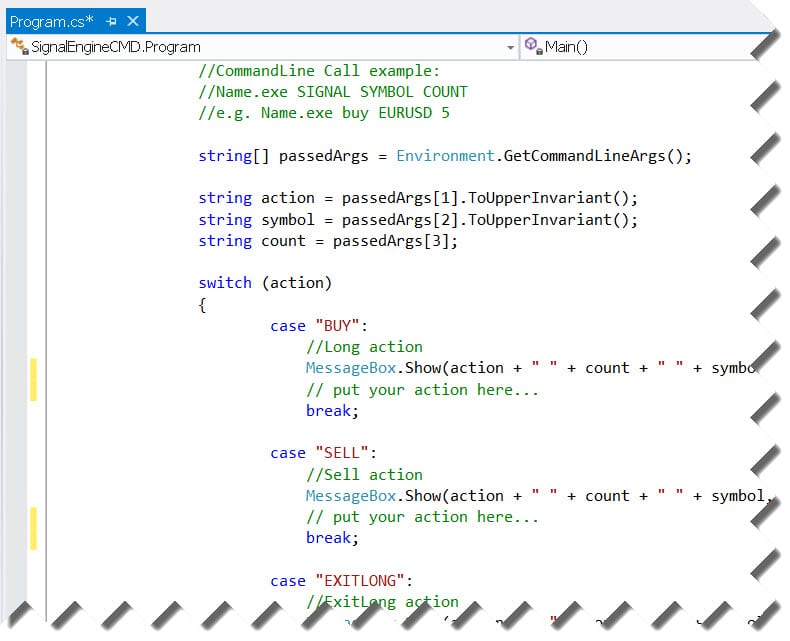
Native C# Scripting
Technical Analysis
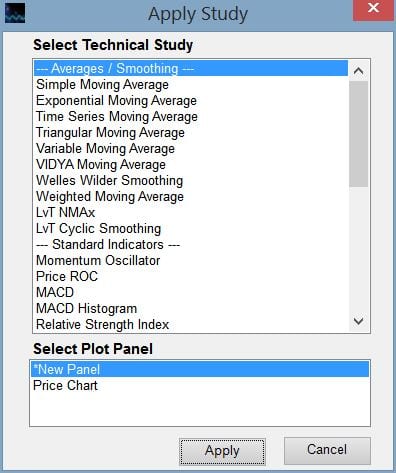
Study-on-Study
Market Replay
Drawing Tools
Custom Indicators & Trading Strategies
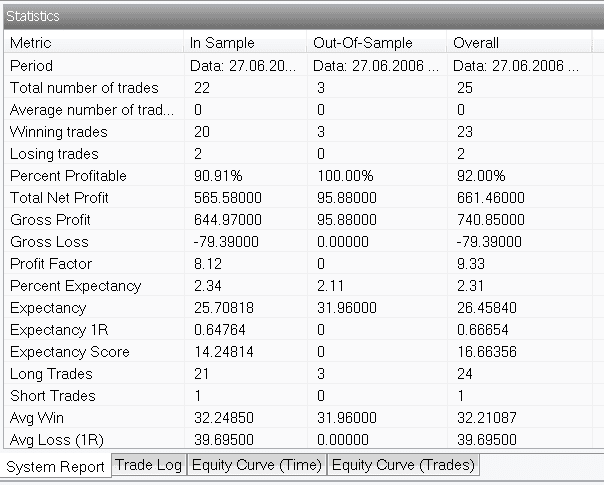
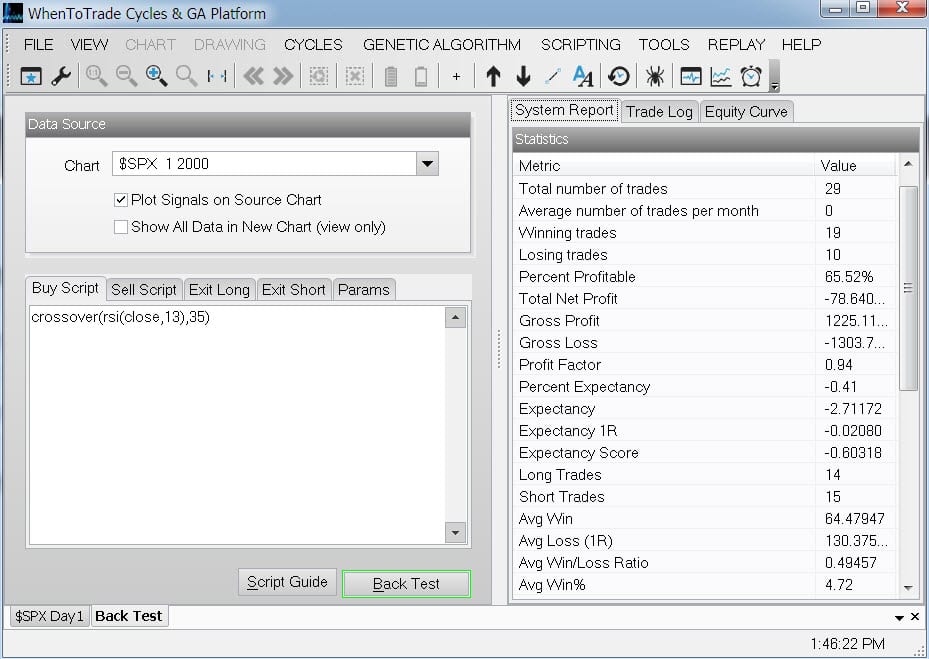
Trading System Analysis & Backtesting
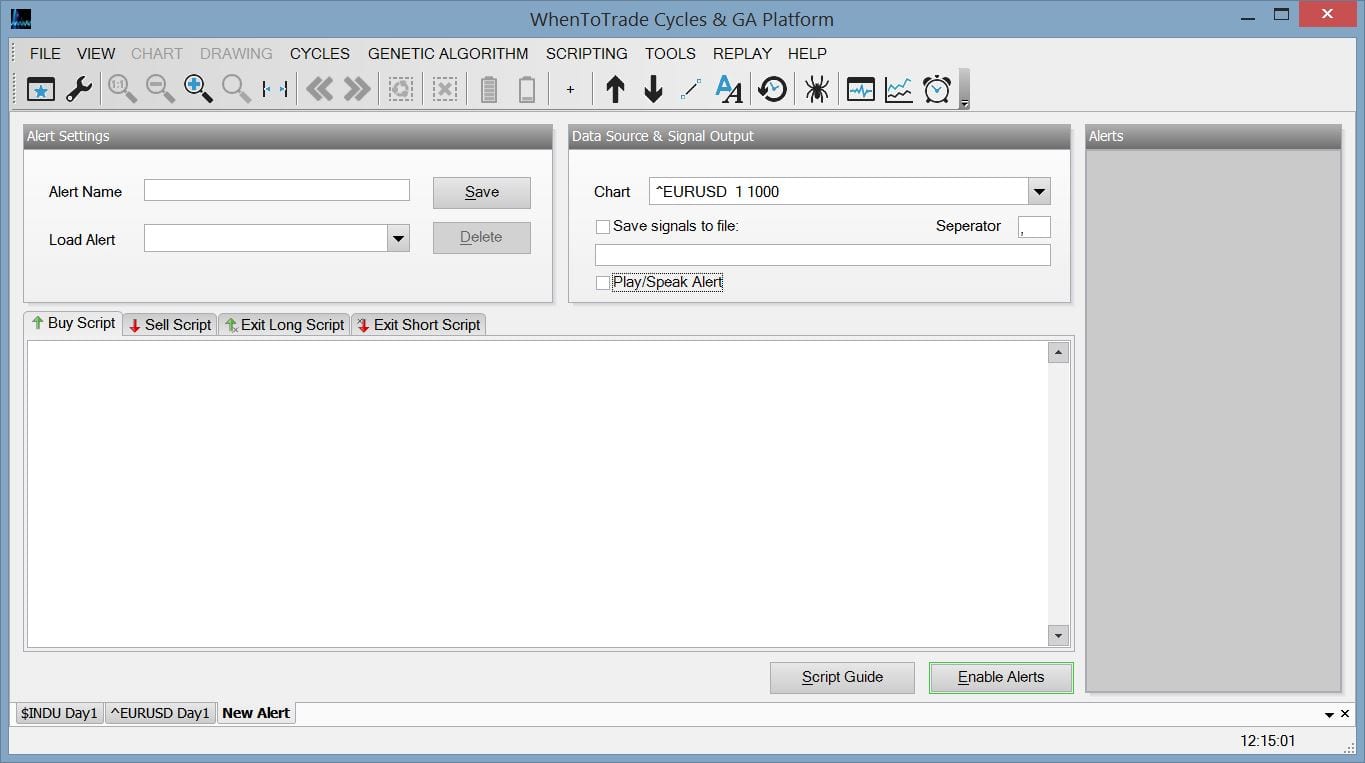
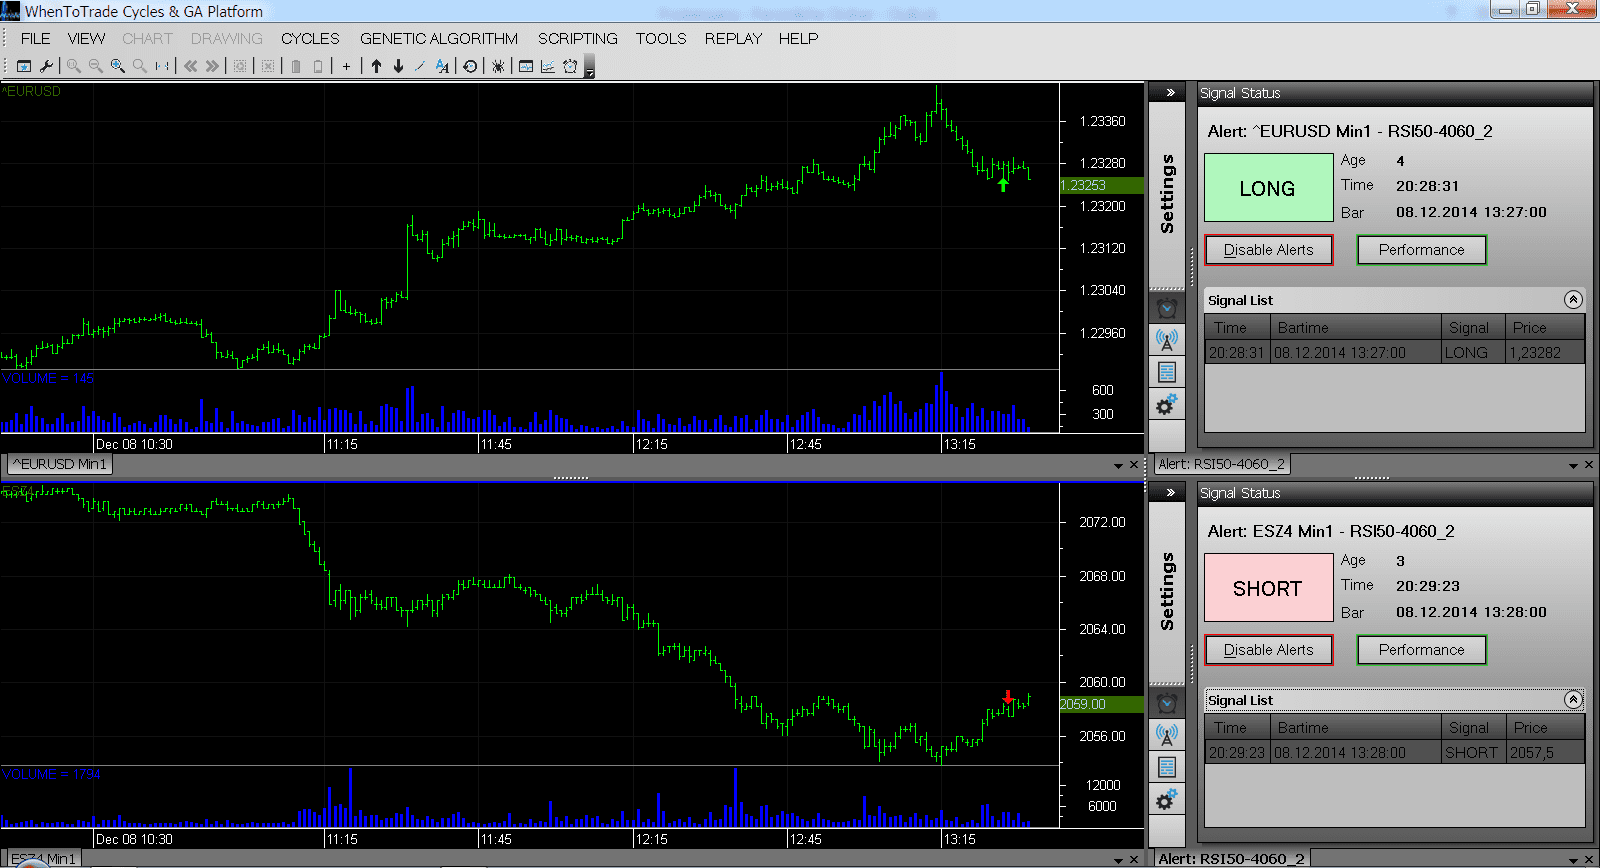
Signal Alerts
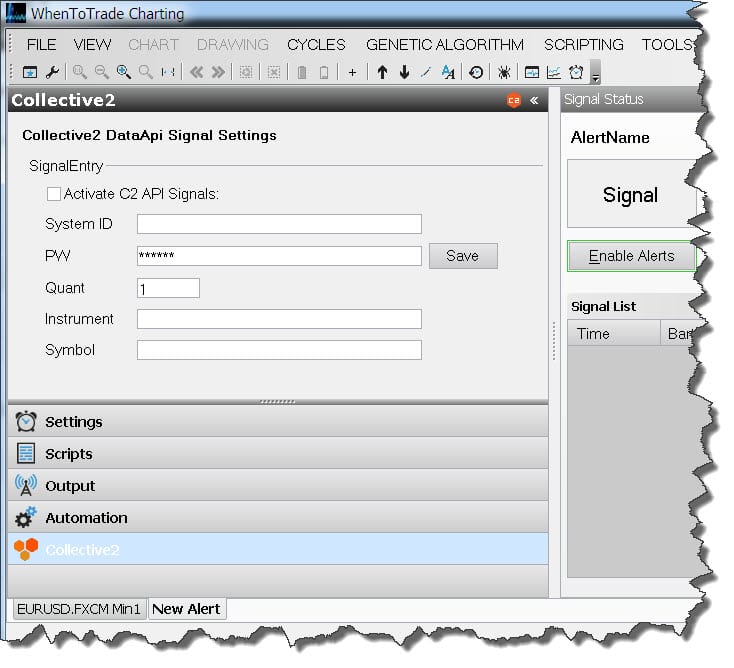
Collective2 Integration
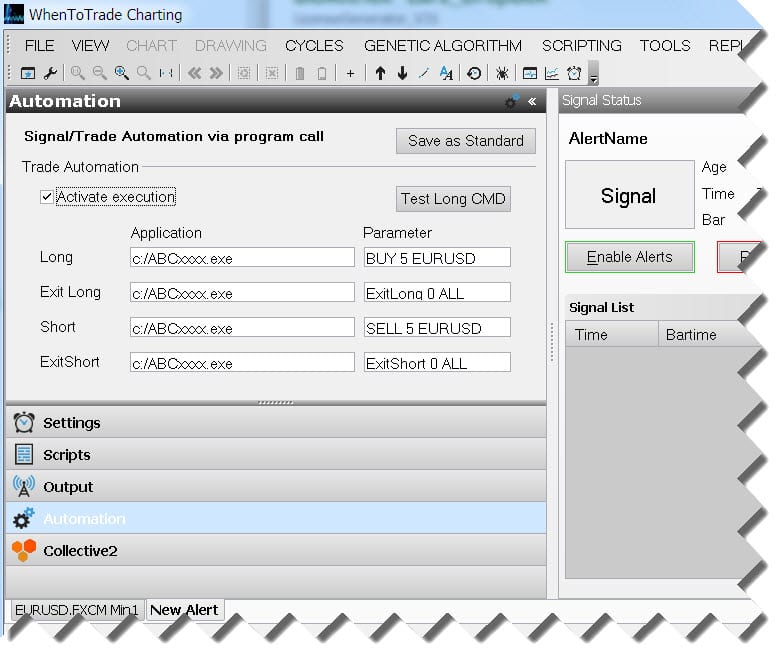
Trade/Alert Automation
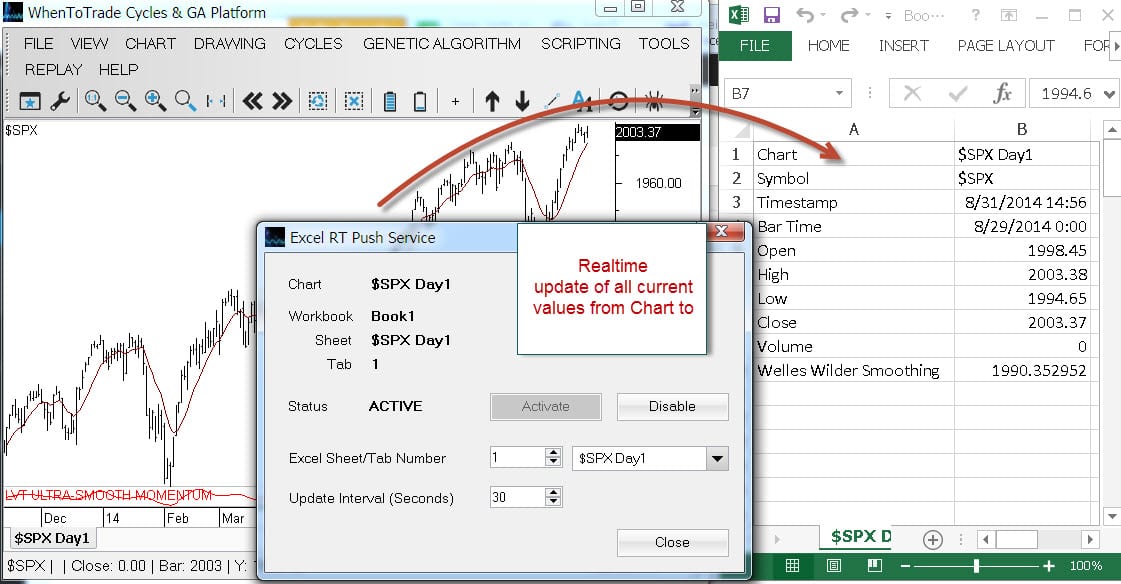
Real-Time Excel Push
Non-Linear Indicators
Symbol Mapping