
Trading Social Media Sentiment Cycles

Author: Lars von Thienen
A realtime example on how to use sentiment data and cycle detection in combination
In recent years, social media has become ubiquitous and important for social networking and online communication among market participants for stock market news. This article demonstrates how social media sentiment can be used to predict financial cycles. In particular, it shows how social chatter, pre-processed from PsychSignal, is used to forecast market turns in silver.
Importance of Social Media Sentiment Cycles
According to many behavioral economics’ studies, mood can profoundly affect individual behavior and decision-making.[i],[ii] Mood predisposes people toward certain decision-making processes. People in a positive mood may credit economic conditions for their personal situation, and a singular positive one-time news event may trigger a long-time bullish investment. People in a negative mood may blame economic conditions for their situation, and a singular one-time news event may trigger the selling of stocks. Thus, unconscious moods can influence conscious financial decisions via an external event, but the root cause is the current underlying sentiment.
People can remember only their emotions and not the underlying mood of financial disposition. This is why they think that “news” moves markets. They remember the big announcement, or the sharp one-minute reaction; but most of them cannot consciously register the unconscious moods that guided the vast bulk of the market’s moves.
For example, if you ask people how they felt at the last market top, they will answer that they have forgotten it already. Further, they think that any fool should have seen that it was a terrible time to own stocks. The brain has no storage mechanism for social mood; it exists only for the moment and moves in dynamic cycles.[iii]
Social mood arises when humans interact socially. A prominent example is the hack on the Associated Press Twitter account in 2013. One social tweet, sent by a hacker into the Associated Press account, implied an attack on the White House and an injured President; consequently, US$136.5 billion was wiped off the Standard & Poor’s 500 Index’s value.[iv] Certainly, this was a temporary one-time event and not driven by cyclic mood. Nonetheless, it shows how important social mood has become.
Normally, social mood waxes and wanes positively and negatively. Whenever mood is related to corporations, the economy, or assets, the character of events will unfold in the related financial assets. Thus, social mood governs financial events, and sentiment waxes and wanes in the form of dynamic cycles.
Cycles are the important structure here because sentiment does not jump rapidly from one state to another. A change of mood requires time; therefore, sentiment moves in dynamic cycles or waves. This is a similar process to changes in air temperature: the outside temperature does not jump from one state to another. Therefore, the significant challenge is to spot and predict turns of the mood cycle.
If we are aware of the fact that mood is the main underlying force in behavioral finance, it is worth being able to detect the underlying dominant “mood cycles.” Currently, the fastest source with a direct response to the identification of social sentiment is the internet. Thus, we no longer need to rely on financial “fear” or “sentiment” indices, which are simply second-order derivatives of monetary vehicles such as volatility. New data sets now provide us with raw mood information from the leading source of social interaction.
Consequently, if you have data sets that provide raw social “mood” information related to financial assets on the one hand, and on the other hand have cyclic tools that are able to decipher and track dominant cycles, you have the tools needed to predict and forecast financial market turns in advance.
If we can extract the dominant cycles of public mood that are related to certain economic vehicles, it would be interesting to see if they are predictive. The next section investigates whether measurements of collective mood states on silver that are derived from social sentiment are correlated to the value of the silver futures’ price over time.
The Situation in November 2014 – Silver to Resume its Downtrend or Experience a Major Turnaround?
Silver futures traded at US$16 after pausing following a long-term downtrend (see Chart 1).
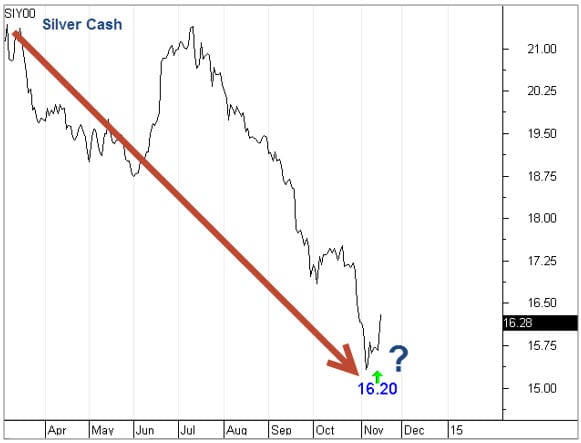
Chart 1: Silver Futures Nov. 2014
At this point, it is always of major importance to know whether this is just a pause in the overall downtrend and whether one would expect silver to resume going down. Alternatively, this may be a major turning point with a large upswing that will drive silver prices higher. At such times, the proposed approach can guide or analyze the process.
First, we need raw mood information about silver. PsychSignal is a young company that provides social sentiment information derived from internet chatter. At every second in every corner of the World Wide Web, millions of people are expressing their emotions. In this context, PsychSignal listens to the crowd’s mood and builds bullish/bearish sentiment data clustered according to financial assets.
PsychSignal tracks sentiment for the iShares Silver Trust (symbol: $SLV), and the data is provided raw for bullishness and bearishness. Such bullish/bearish data is also available free on Quandl with the symbol: PSYCH/SLV_I. Thus, you can make your own checks. However, you need to be aware that the data provided via Quandl has gaps although good cycle tools can bridge single gaps in the detection algorithm. Consequently, the gaps need not critically affect cycle analysis.
A first step to take before we can use our cycle analysis is to build a composite sentiment score based on the two data sets. We simply calculate the composite silver sentiment by subtracting the bearish value from the bullish value. Thus, the most bullish day with the lowest bearish value has the highest silver sentiment score.
Chart 2 shows the composite sentiment value plotted on a chart. We additionally smoothed the data shown by the red line.
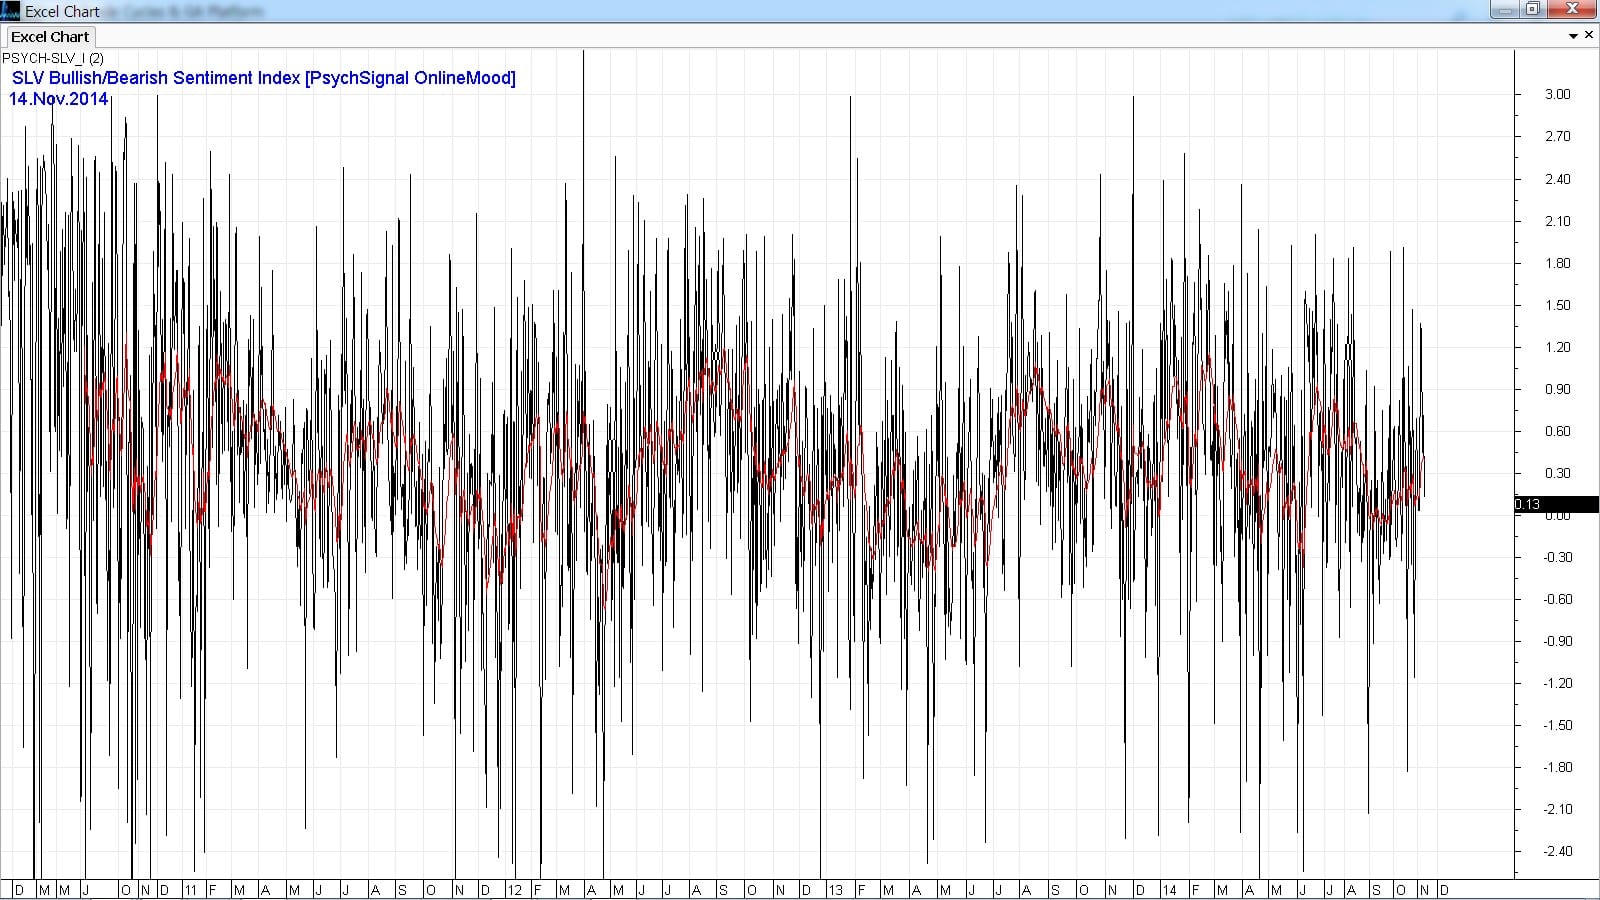
Chart 2: PsychSignal Silver Bullish/Bearish Composite Index
In theory, as with all sentiment vehicles, the scores work as contra-indicators. Thus, extreme points of bullishness should correspond to market tops, and extreme bearish composite scores should correspond to market bottoms. However, these are only seen after the fact. Therefore, the cyclic approach is useful because cycles can be plotted into the future and can spot major turning points.
Dominant Social Sentiment Cycles of Silver in November
Next, we need to attach cycle detection algorithms to the composite social sentiment score we have on the chart. The WhenToTrade (“WTT”) platform has one of the best embedded cycle detection algorithms and deciphers the underlying dominant cycle. WTT provides a Dynamic Cycle Explorer toolset that is designed specifically to detect and track cycles that do not stay static in real-time data sets.
This is very important because we do not want to detect static cycles that fit to the past – we need cycles that can explain the past but focus more on staying in sync with current market characteristics.
Consequently, these cycles are “allowed” to breathe and change length and amplitude in real market conditions.
The Dynamic Cycle Explorer is simply anchored to one top or low in the past and detects underlying cycles completely automatically.
Chart 3 shows the SLV sentiment composite with the attached Dynamic Cycle Explorer indicator. ( CHART3: Large picutre link )
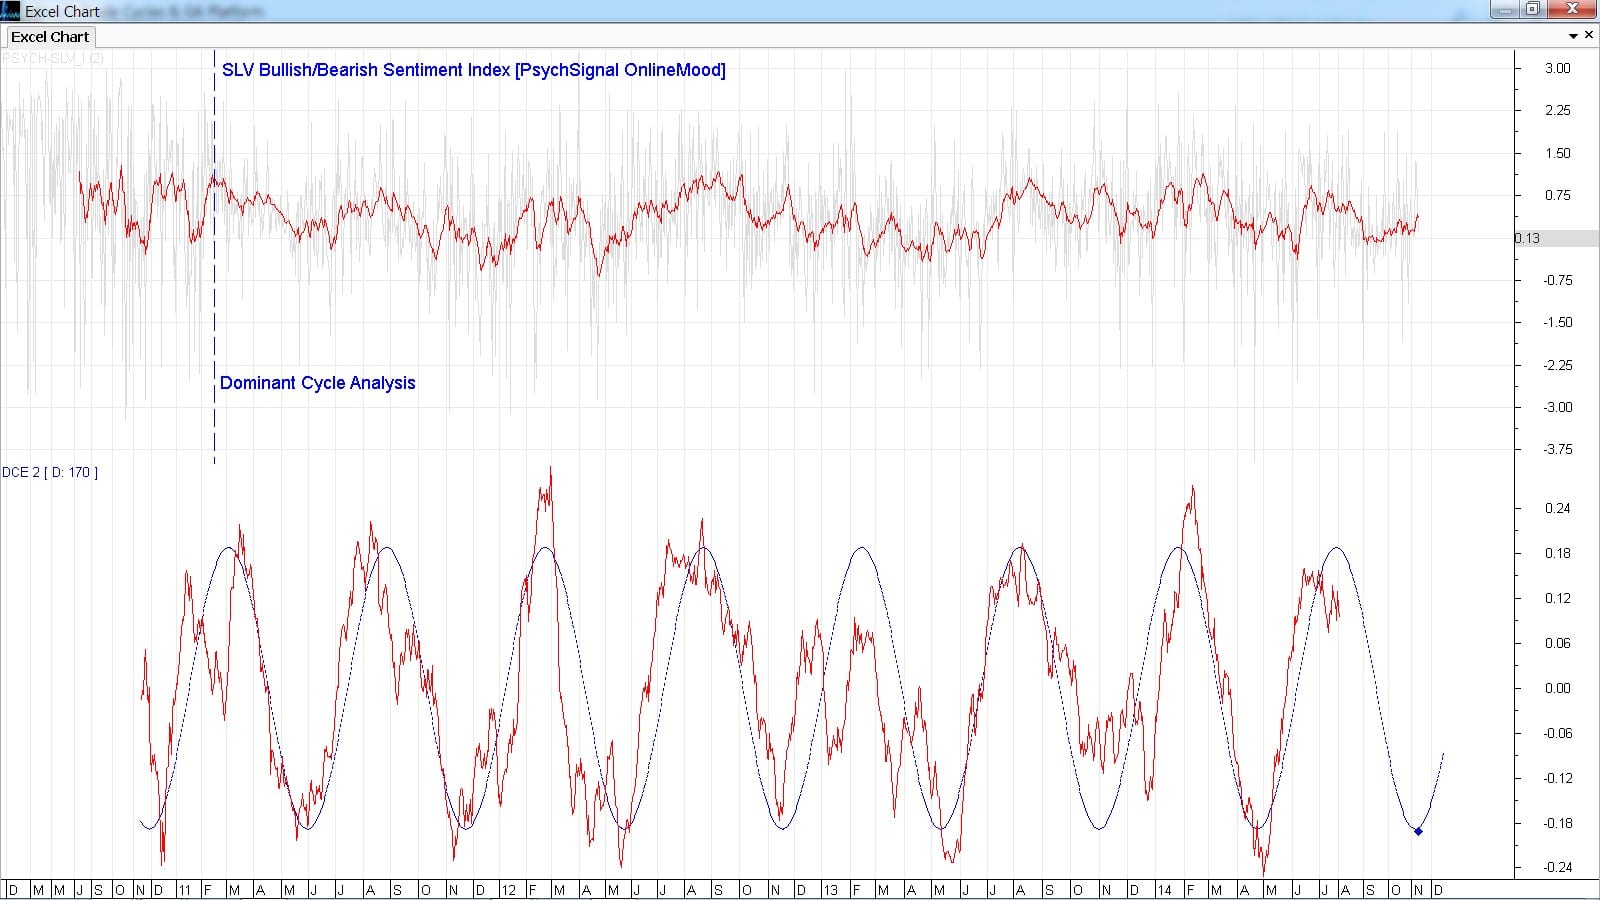
Chart 3: Automatic detected Dynamic cycle plotted below Sentiment Index
The window at the bottom of the chart shows the detected dominant cycle as a blue line. The indicator text shows that there is an underlying cycle with an active length of 170 days in the SLV silver sentiment data set. The red plotted data behind the blue cycle shows that we have a valid match between the ideal cycle and the real score movements on the sentiment. You can compare the highs and bottoms of this cycle match with major turns in the sentiment index. Thus, we have a clue to the fact that a 170-day cycle has driven social sentiment during the last two years. The most important point is the current day because we do not need a perfect fit in the distant past. Further, we know that cycles have a dynamic nature; therefore, the most important time period is the current past where the cycle parameters have to be in alignment with the real world.
Before we start to interpret the current conditions, though, we must check if this cycle – which is only related to social sentiment and has nothing to do with real price data – has correlations to turns in the price of silver.
Thus, Chart 4 shows the silver price plotted on top of this analysis. ( CHART4: Large picture link )
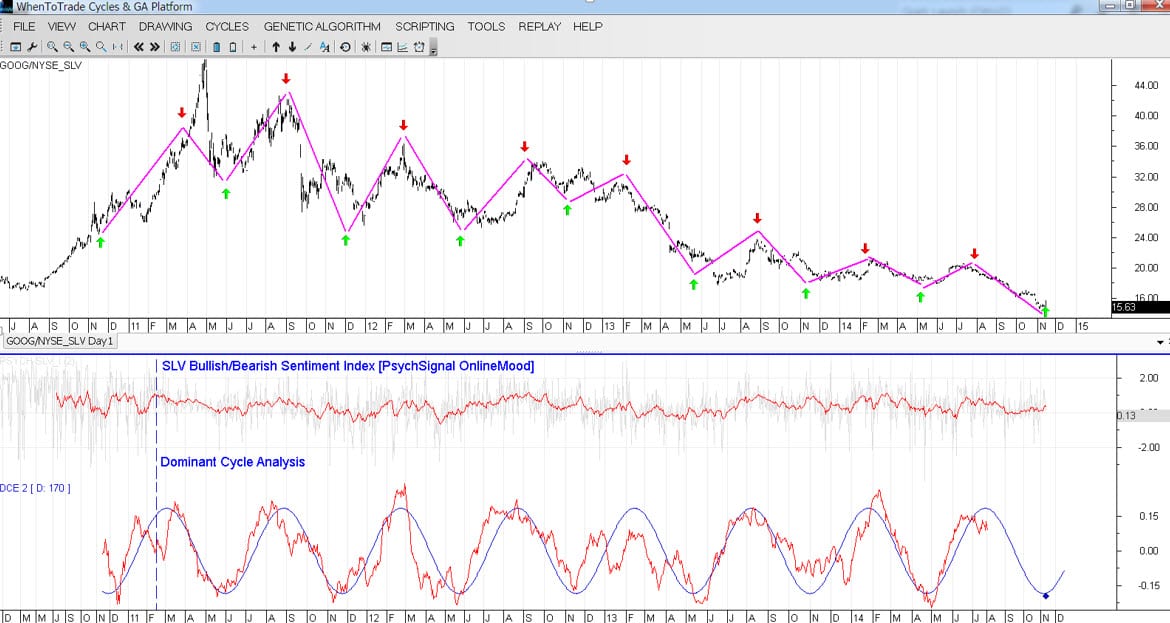
Chart 4: Social media sentiment cycle and Silver price chart
The turns of the discovered dominant cycle are marked with red and green arrows on the price chart. We can see that we have an ideal fit between the social sentiment cycle and price turns in silver. However, this cycle does not become visible on the price chart alone; further, the cycle does not predict the strength of each move following a change in trend. To see the situation more clearly, we have added a purple line to connect the arrows on the price chart.
We have now validated that the detected cycle has a high correlation to price turns in silver futures.
Current Situation of Social Sentiment for Silver
Following the above analysis, we are now aware of the current dominant sentiment cycle that is based on harvested online conversations.
The distinct psychological expressions of emotion or attitude from these conversations have then been clustered into our manually built Silver Composite Index. In this context, it is more interesting to decipher the underlying pattern in the form of dynamic sentiment cycles than to try to interpret the raw sentiment data. In general, the raw turns of mood will not match price turns exactly because there are delays, noise, and distortions between mood and the unfolding events. Consequently, we are not interested in the exact micro turns of mood on the price chart; instead, we are looking for the general mood cycle to change its direction. History has shown that these general turns are accompanied by general price turns. These are what Dynamic Cycle Explorer is capable of detecting and tracking in real-time.
As a result, we can pay close attention to where we are now in this sentiment cycle. The data analysis was done on November 15, 2014. The blue dot on the cycle marks the current day of the analysis. The important point here is that the dominant cycle shows an imminent bottom with an extreme reading of bearishness.
So we would expect the sentiment to rise over the next weeks with an expected price increase of silver happening in parallel. [15th Nov. 2014]
Thus, we would not expect the downtrend to resume shortly; instead, we would expect a major upswing in the silver price that follows the dominant active sentiment pattern.
We now move forward eight weeks and check the forecast.
Chart 5 shows the same silver cash price that was shown at the beginning of this example and progresses it eight weeks to January 25, 2015.
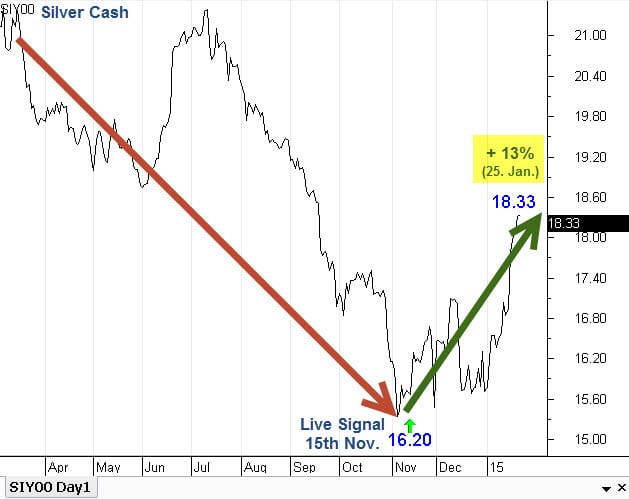
Chart 5: Silver cycles forecast result
Silver price turned up by +10% following the forecast.
It is important to mention that the cycle analysis shown in this article about silver mood was conducted live and in real time. This example was not cherry-picked. We alerted our community on November 15 about this issue in the public open internet magazine available at whentotrade.com.
Therefore, this is a genuine forecast based on the power of dynamic cycle tracking tools and the new area of available sentiment data sets.
This article underpins the importance of cyclic research in social sentiment data sets in order to forecast important market turns. Thus, the combination of state-of-the-art sentiment data from PsychSignal with the latest cycle analysis and prediction tools from WTT delivers a truly unique view on financial markets.
There are also other sources and tools available that enable you to gain a new perspective and trading ideas in order to put social sentiment cycles into trading practice.
The silver forecast was made public here in this article in November 2014: Magazine Article
Please read the attached pdf article:
Watch the making of for full coverage on this topic:
Video: “Making of” Silver Sentiment Forecast
References:
[i] J. Bollen, H. Mao.: Twitter mood predicts the stock market. Journal of Computational Science, 2(1), March 2011, Pages 1-8.
PDF: http://cs229.stanford.edu/proj2011/GoelMittal-StockMarketPredictionUsingTwitterSentimentAnalysis.pdf
PDF: http://arxiv.org/pdf/1010.3003v1.pdf
[ii] LAI Kaisheng, CHEN Hao,YUE Guoan: Can Mood Predict Stock Market?[J]. Advances in Psychological Science, 2014, 22(11): 1770-1781.
[iii] Socionomics Explained, An Interview with Robert R. Prechter, Jr
http://www.socionomics.net/socionomics-explained/
[iv] AP Twitter Account Hacked in Market-Moving Attack, April 2013, Bloomberg


Leave a Reply
Want to join the discussion?Feel free to contribute!