After 3 comes 4… ?
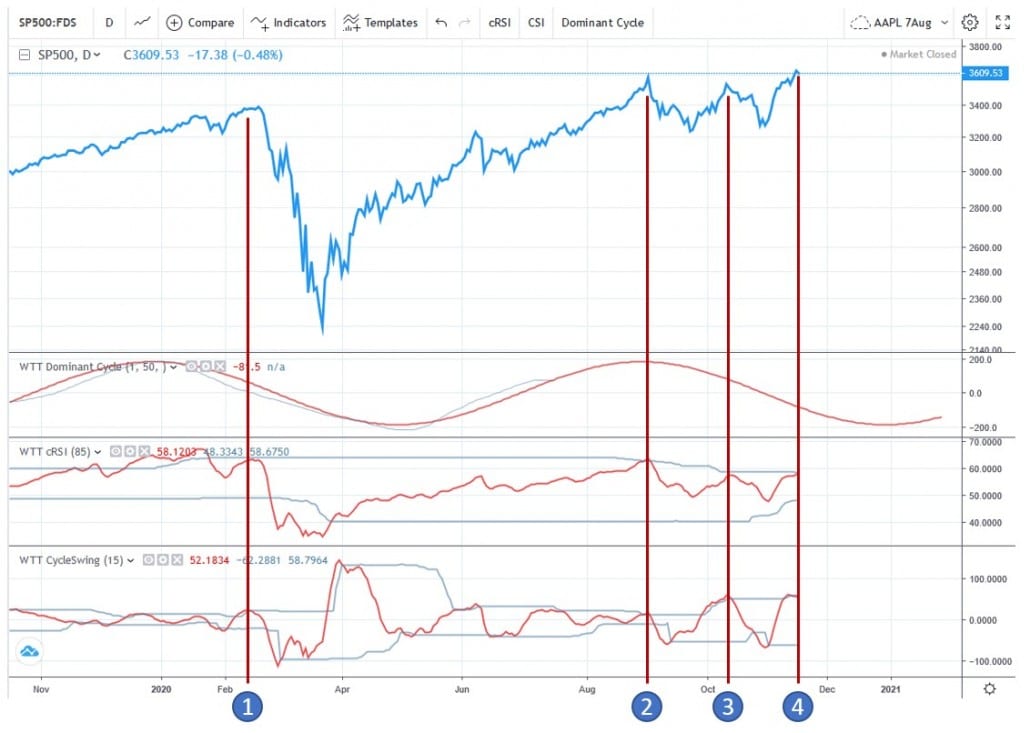
The S&P500 chart shows the dominant cycle with a length of ~175, paired with our key technical indicators, the Cycle Swing and the cyclical RSI. Please check the highlighted 3 situations: If all 3 indicators were in agreement, they indicated a subsequent downturn.
Today, we observe count #4 of this signal.